Fig. 12
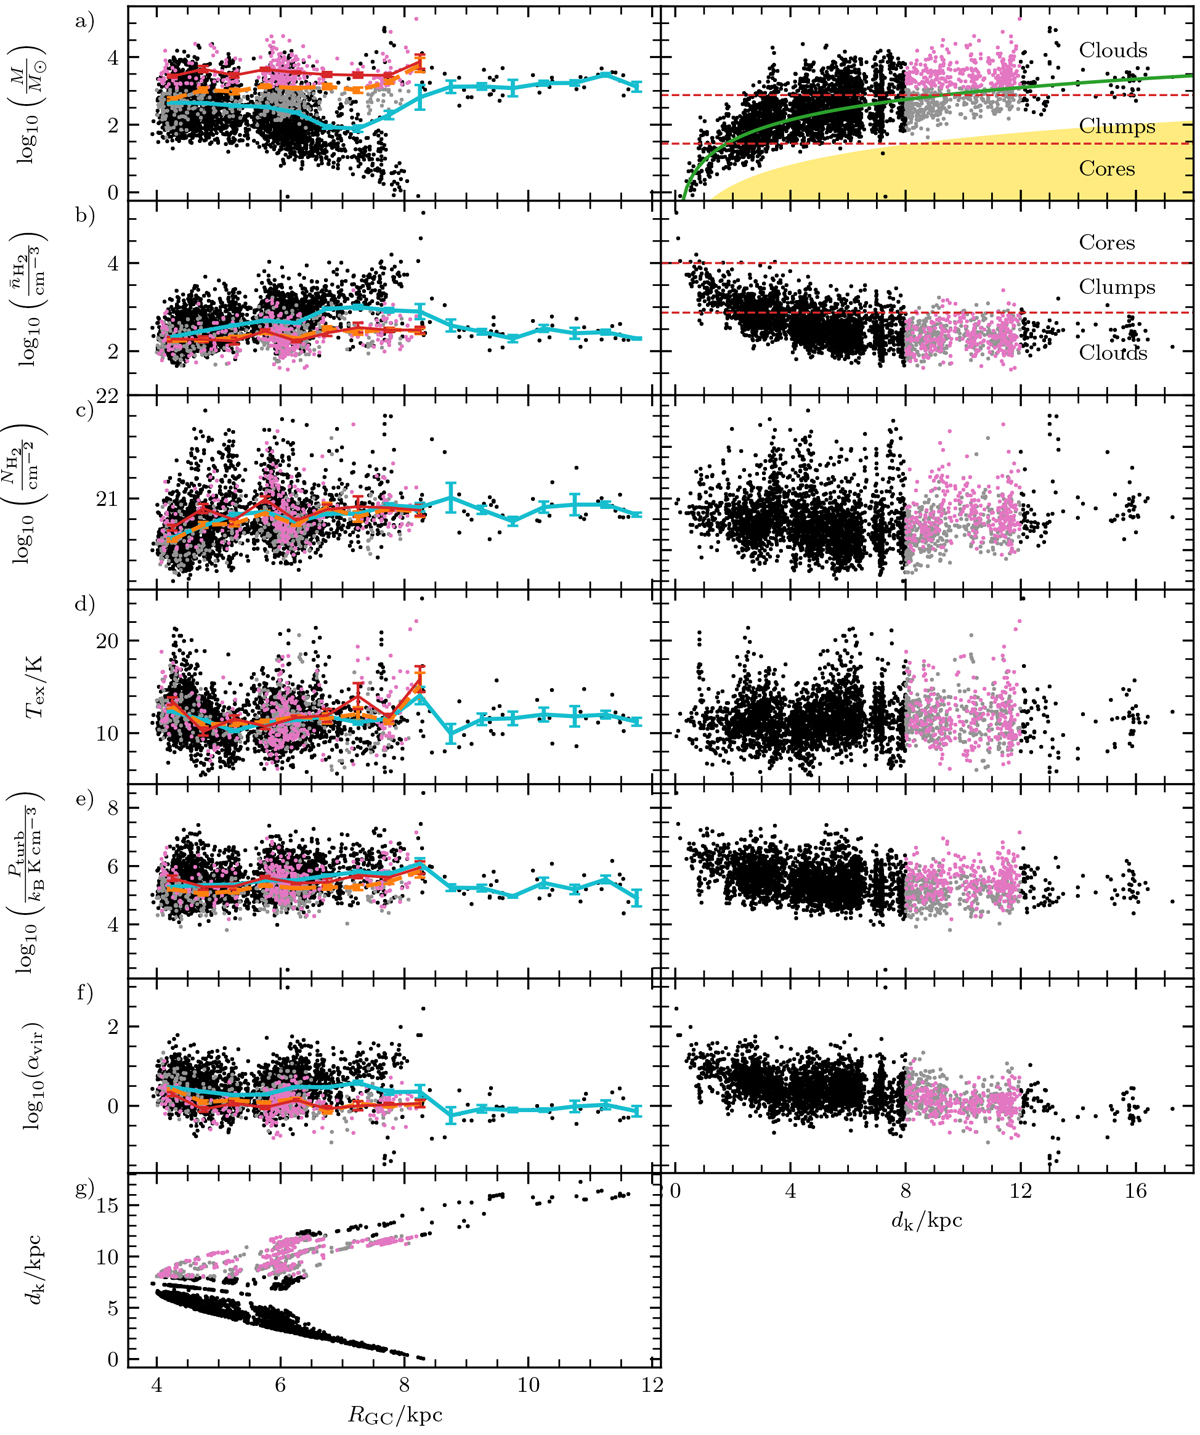
Various properties measured for the CHIMPS clumps as functions of both Galactocentric (left column) and heliocentric distance (right column): (a) total clump mass; (b) volume-averaged number density (c) mean of the voxel column density distribution associated with the clump; (d) mean excitation temperature; (e) turbulent pressure; (f) virial parameter; and (g) heliocentric distance. In each case, the distribution of black points shows the full sample (described in Sect. 5), while the grey points show a heliocentric distance-limited subsample, lying between 8 ≤ dk ≤ 12 kpc. The pink points show clumps from the distance-limited subsample that lie above the mass completeness limit at 12kpc. On the Galactocentric distance distributions, the blue trend lines show the mean values of clumps in 0.5 kpc-wide bins; while the orange trend lines show the same averages, but for the distance-limited subsample; and the thin red line shows the trend for the mass-complete distance-limited subsample. In the heliocentric-distance column, the dashed red lines denote approximate boundaries between the Bergin & Tafalla (2007) “cloud”, “clump”, and “core” definitions. The green curve in the M-dk panel denotes the 90% completeness limit for compact sources, while the yellow shaded region denotes the parameter space below the 5σ survey sensitivity.
Current usage metrics show cumulative count of Article Views (full-text article views including HTML views, PDF and ePub downloads, according to the available data) and Abstracts Views on Vision4Press platform.
Data correspond to usage on the plateform after 2015. The current usage metrics is available 48-96 hours after online publication and is updated daily on week days.
Initial download of the metrics may take a while.