Fig. 10
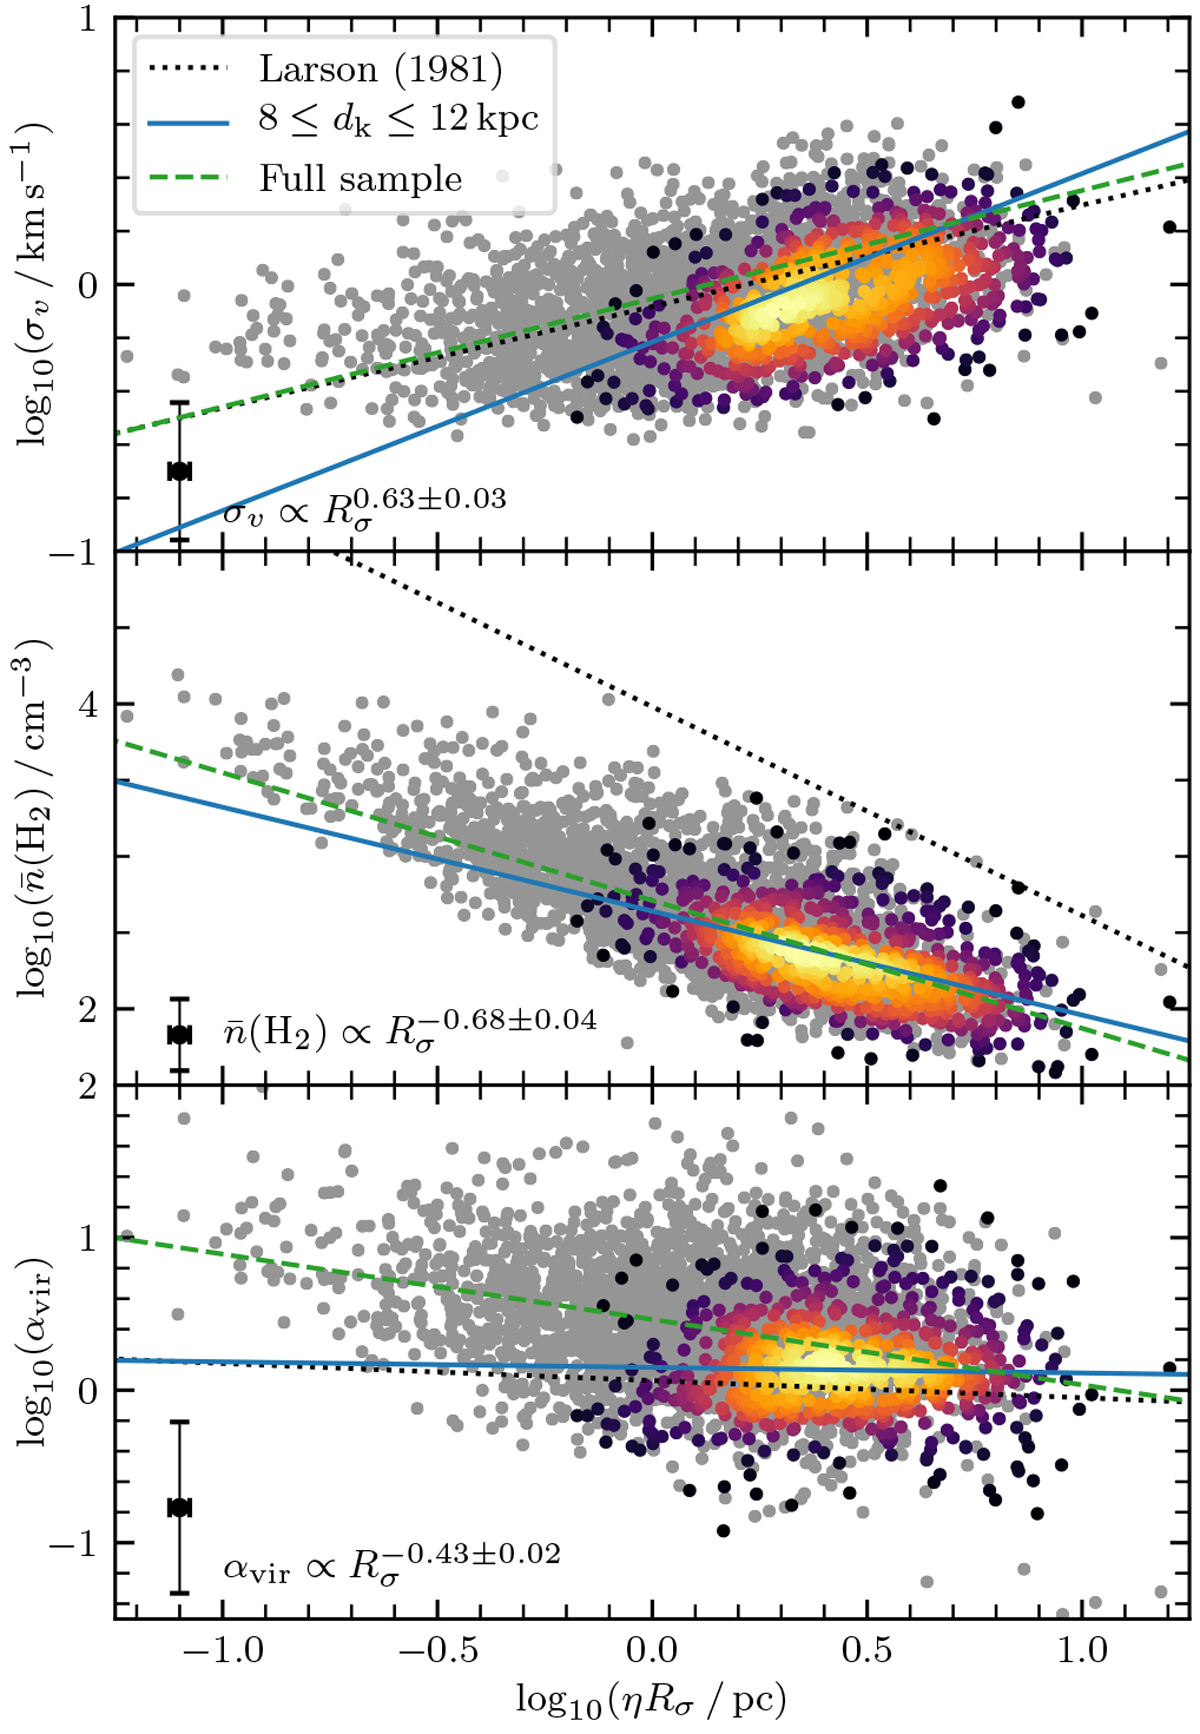
Size–linewidth (top panel), size–density (middle panel), and size–virial parameter (bottom panel) relationships for the CHIMPS clumps, where the size parameter is the scaled intensity-weighted rms size (described in the text), ηRσ, for which η = 2.0. In each case, the grey data points show the full sample, while the distance-limited sample is shown as colour-scaled data points, for which the lightest colours indicate the highest density of points. The blue lines show the best-fitted power-law for the distance-limited sample, for which we display the median error bars on the black data point in the lower-left corner. Thedashed green lines show the best fits to the full sample. The relationships derived in Larson (1981) are shown as black dotted lines for reference, and have been rescaled to match these quantities. Full details of the fits are given in Table 5.
Current usage metrics show cumulative count of Article Views (full-text article views including HTML views, PDF and ePub downloads, according to the available data) and Abstracts Views on Vision4Press platform.
Data correspond to usage on the plateform after 2015. The current usage metrics is available 48-96 hours after online publication and is updated daily on week days.
Initial download of the metrics may take a while.