Fig. 1
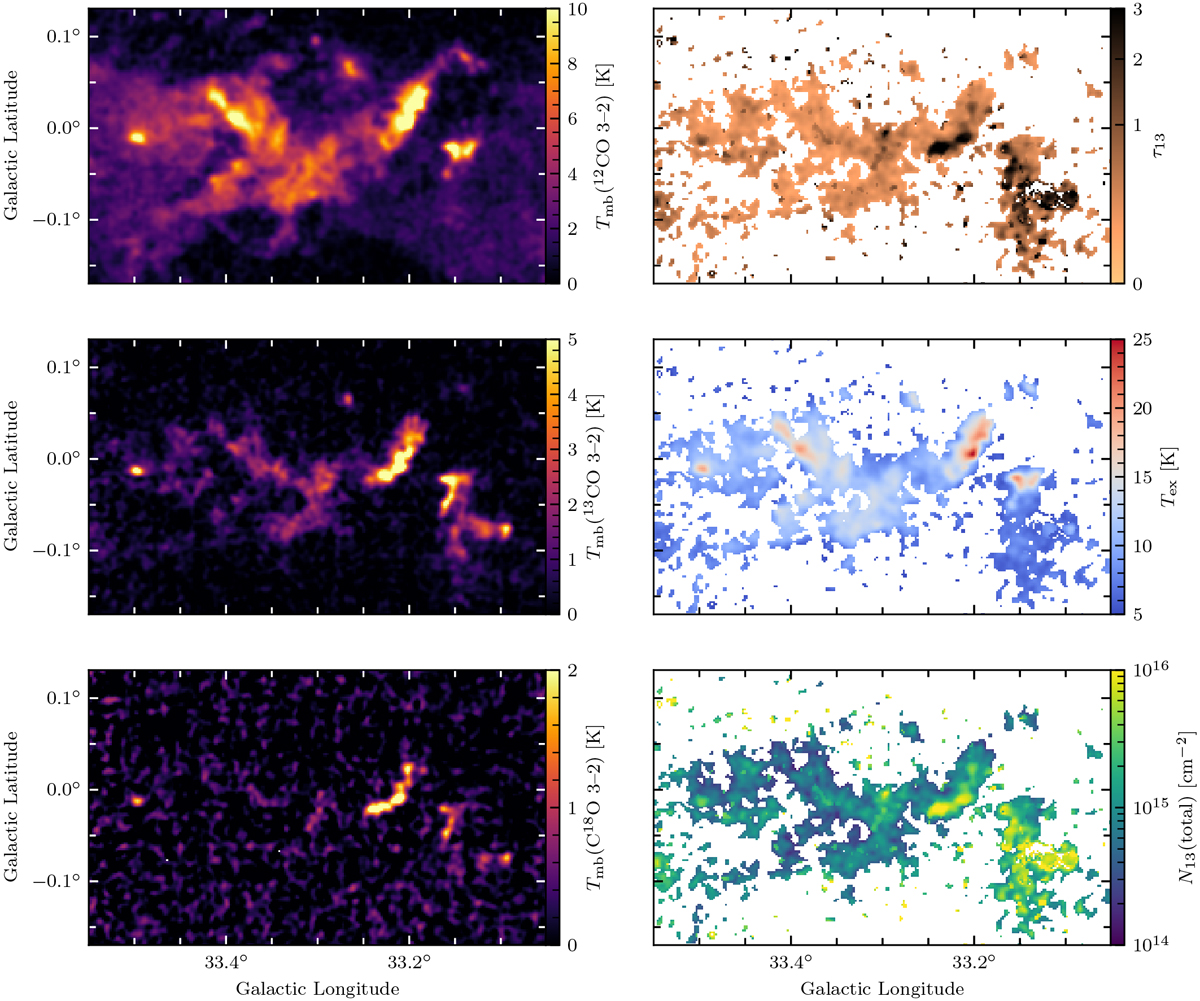
Demonstration of the LTE methodology used in this study for a region centred on ℓ = 33.3°, b = −0.02° in the 101.22 km s−1 velocity channel. In the left column, the intensities of the three CO emission lines: COHRS 12CO (3–2) (top panel), CHIMPS 13CO (3–2) (middle panel), and CHIMPS C18O (3–2) (bottom panel) are shown. In the right column, the derived LTE properties: the 13CO (3–2) optical depth (top panel), the excitation temperature (middle panel), and the total 13CO column density (bottom panel) are also shown.
Current usage metrics show cumulative count of Article Views (full-text article views including HTML views, PDF and ePub downloads, according to the available data) and Abstracts Views on Vision4Press platform.
Data correspond to usage on the plateform after 2015. The current usage metrics is available 48-96 hours after online publication and is updated daily on week days.
Initial download of the metrics may take a while.