Fig. 4
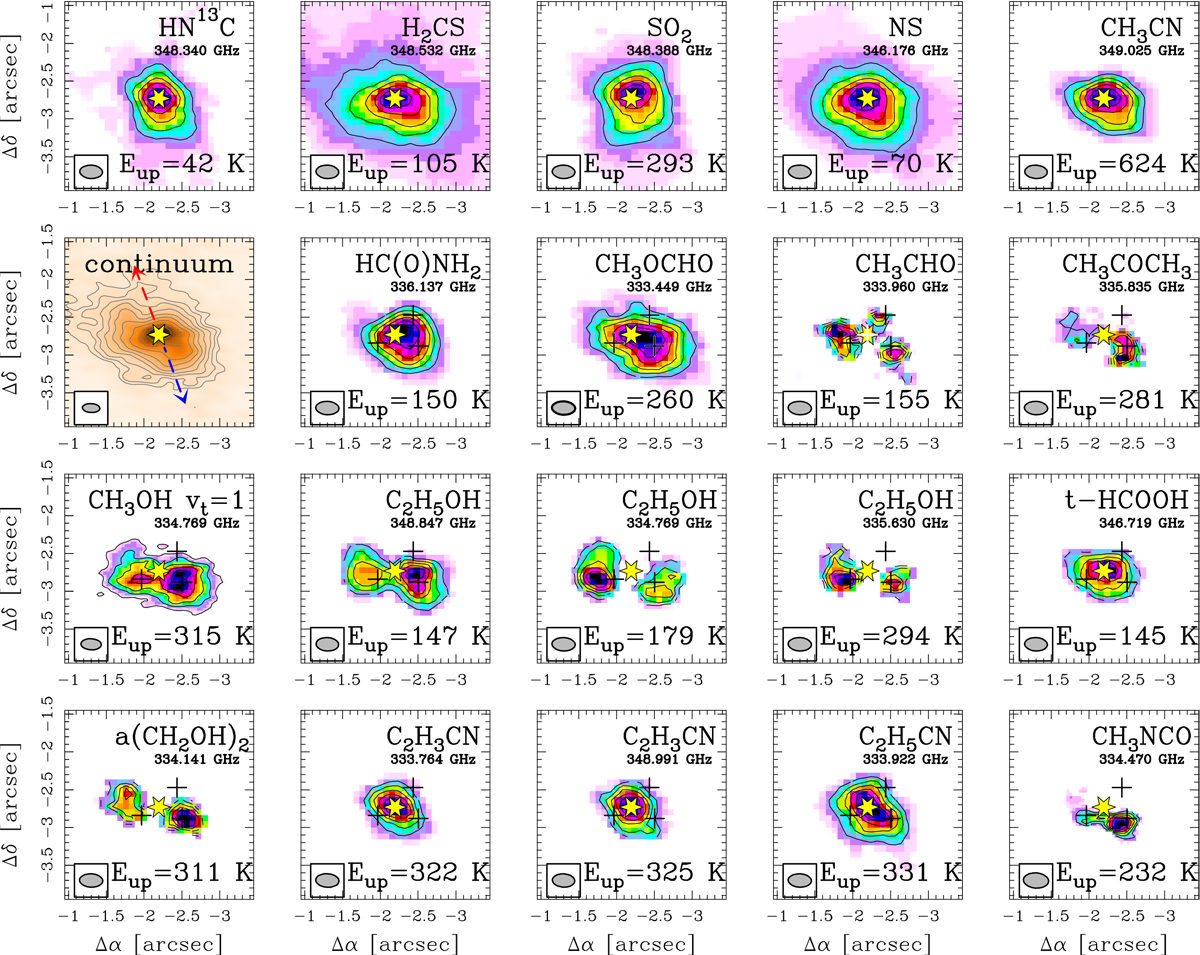
Zeroth moment maps of some simple molecules, and selected transitions of COMs. All contours correspond to significant emission and start at 20% of the maximum value and increase by 15% of the maximum value. Yellow star marks the position of the dust continuum peak corresponding to the central protostar. The beam is shown in the lower left corner. Labels indicate the shown molecular species. One figure shows the continuum as a reference, where the scale and contours are the same as in Fig. 1.
Current usage metrics show cumulative count of Article Views (full-text article views including HTML views, PDF and ePub downloads, according to the available data) and Abstracts Views on Vision4Press platform.
Data correspond to usage on the plateform after 2015. The current usage metrics is available 48-96 hours after online publication and is updated daily on week days.
Initial download of the metrics may take a while.