Fig. 3
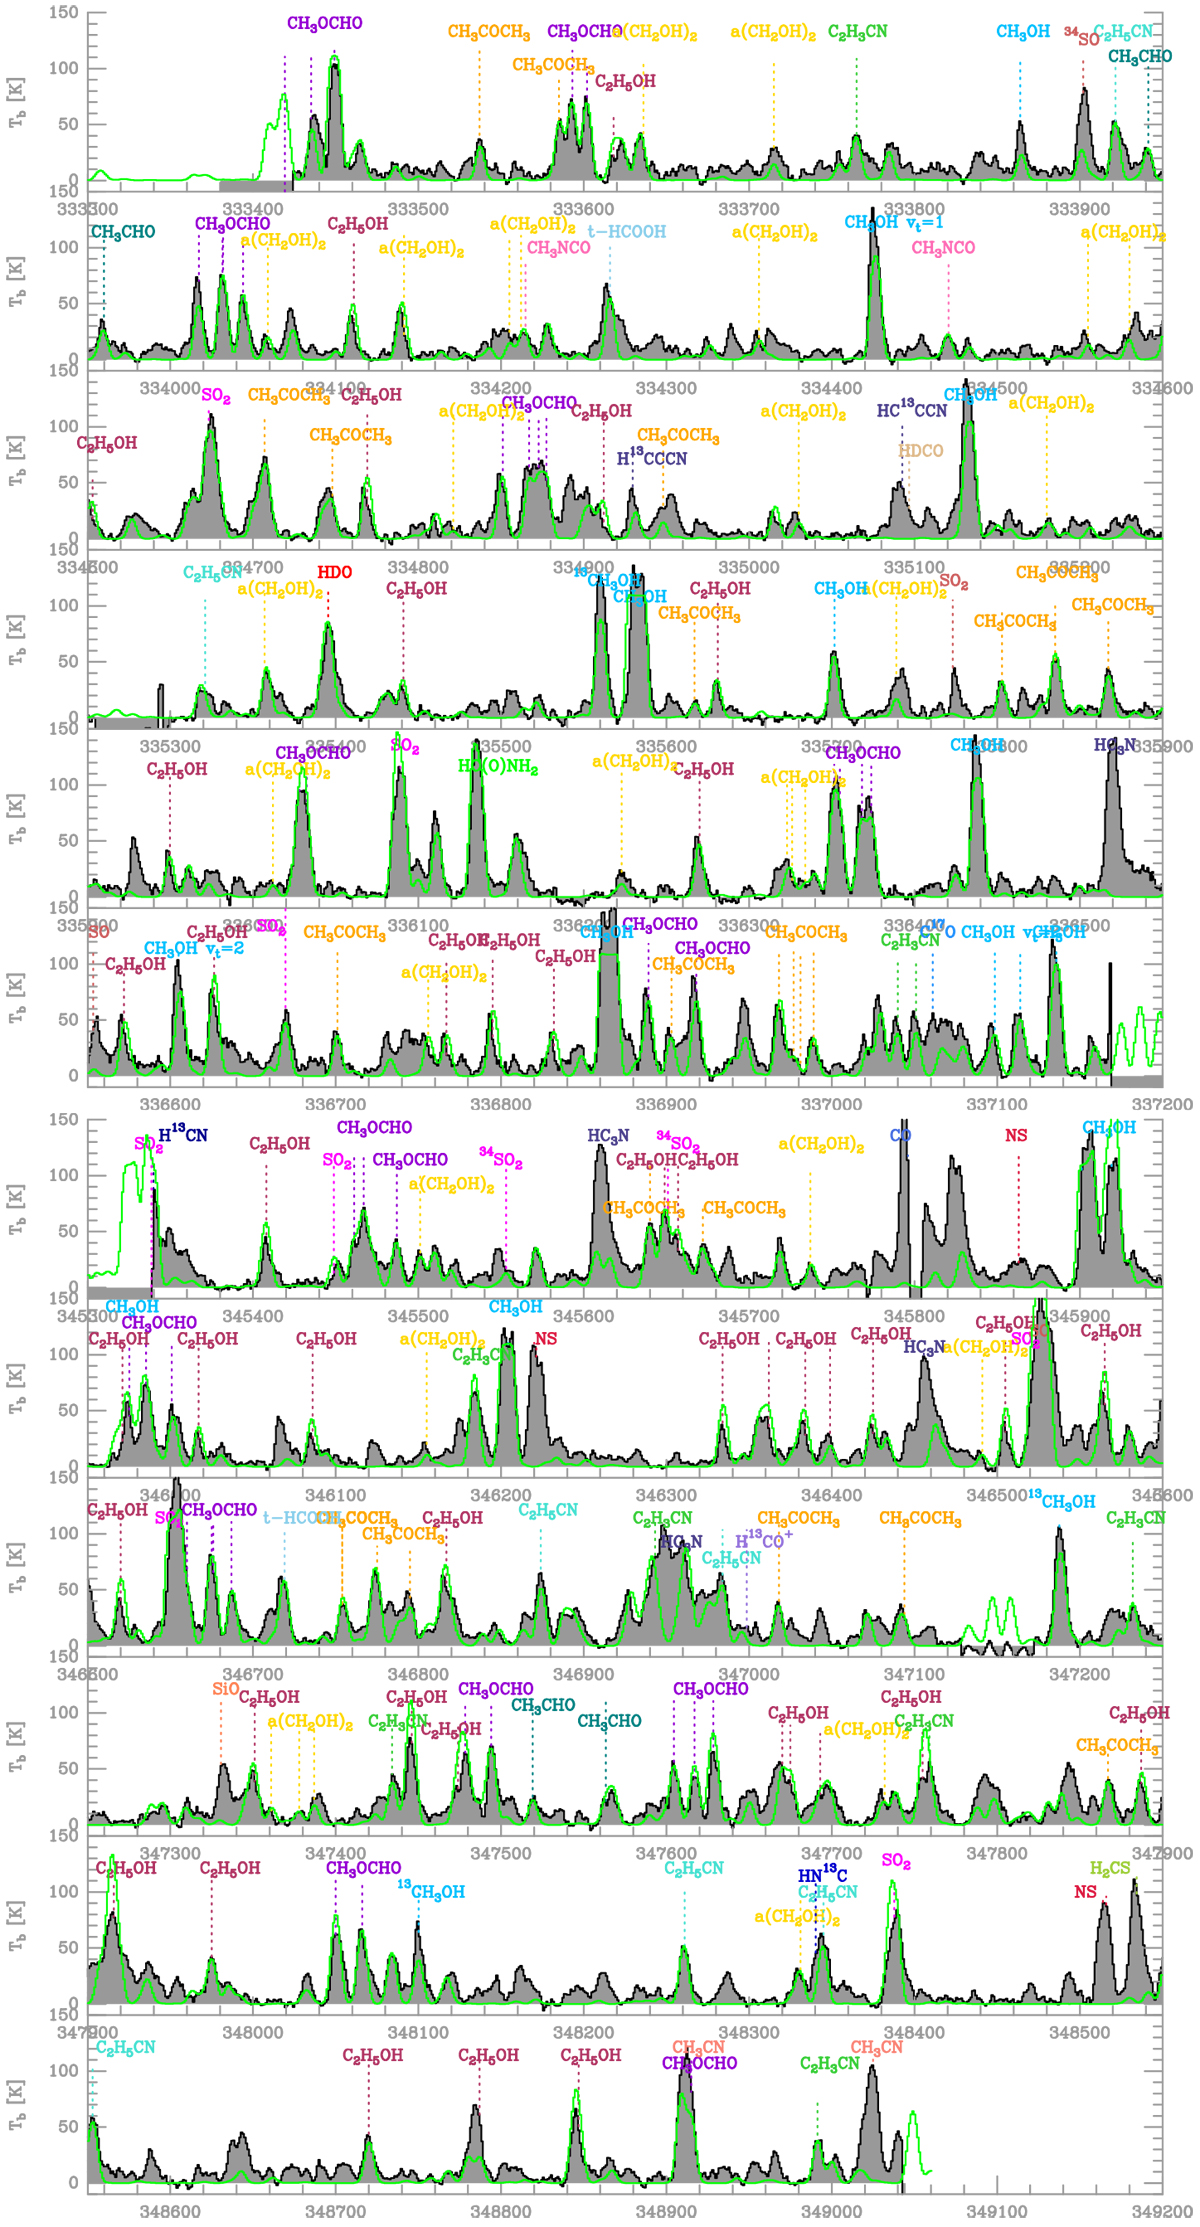
Spectrum extracted towards the B-shock position from Paper I. Grey filled histogram shows the observed spectrum converted to brightness temperature (Tb) scale, greenline shows the composite LTE model including the species listed in Table 3. Coloured labels indicate the least blended transitions of the modelled COMs, as well as other species identified in the spectrum (Table 1). Each colour represents a different molecule and includes its isotopologues as well.
Current usage metrics show cumulative count of Article Views (full-text article views including HTML views, PDF and ePub downloads, according to the available data) and Abstracts Views on Vision4Press platform.
Data correspond to usage on the plateform after 2015. The current usage metrics is available 48-96 hours after online publication and is updated daily on week days.
Initial download of the metrics may take a while.