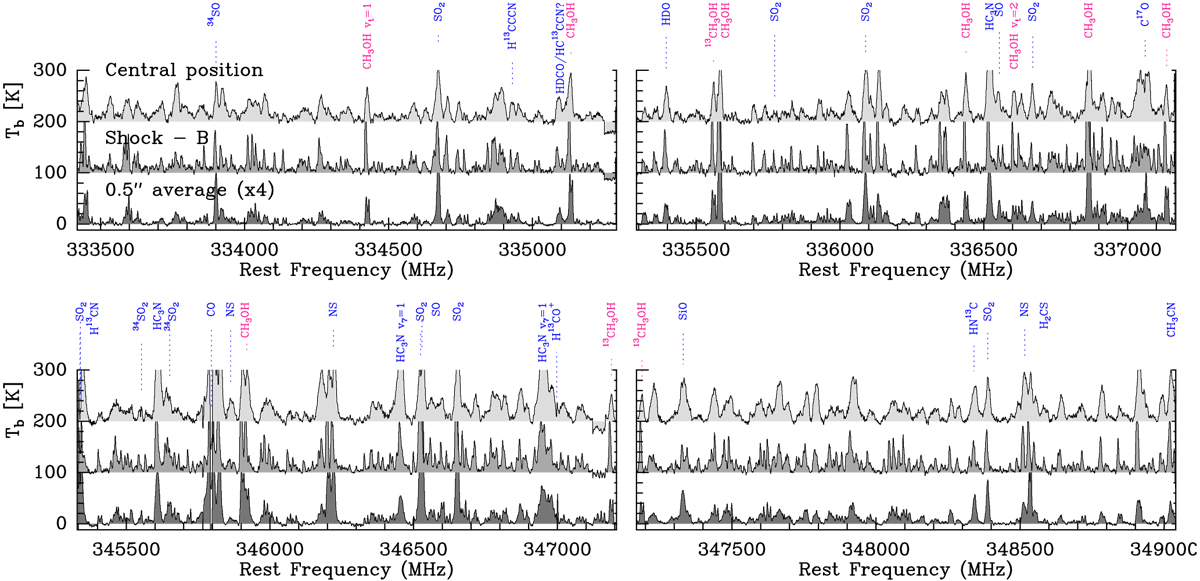
Fig. 2

Grey filled histograms show spectra converted to brightness temperature (Tb) scale: spectrum extracted towards the central position, the B-shock position, and an average within a radius of 0.′′ 5 around the peak of the dust continuum emission, which is multiplied by a factor of 4 for a better visibility. The blue labels show the species listed in Table 1, pink labels show transitions of CH3OH (and its isotopologue) discussed in Paper I. The spectra have been shifted along the y-axis for a better visibility.
Current usage metrics show cumulative count of Article Views (full-text article views including HTML views, PDF and ePub downloads, according to the available data) and Abstracts Views on Vision4Press platform.
Data correspond to usage on the plateform after 2015. The current usage metrics is available 48-96 hours after online publication and is updated daily on week days.
Initial download of the metrics may take a while.


