Fig. 1
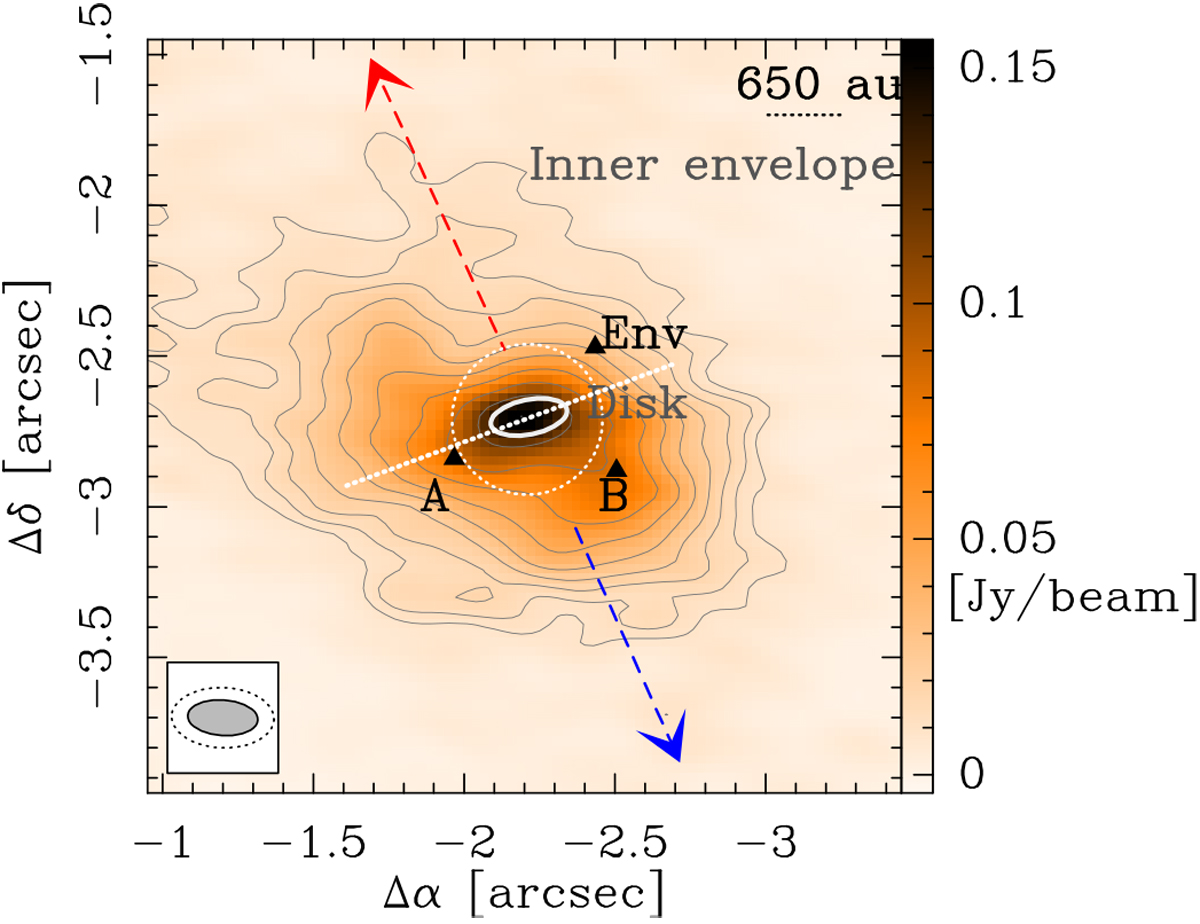
Line-free continuum emission map at 345 GHz combining ALMA 12 m and 7 m arrays from Paper I imaged with robust parameter of − 2 giving a beam size with a geometric mean of 0.″16. The colour scale is linear between − 3σ and 120σ, where 1σ is 1.3 mJy beam−1, contours start at 7σ and increase on a logarithmic scale up to 120σ by a factor of 1.37. The red and blue dashed lines show the direction of the CO outflow. The dotted line indicates the direction perpendicular to the outflow, and the white ellipse shows the position of the accretion disk from Paper I. The HPBW of the synthesised beam is shown in the lower left corner; the filled ellipse corresponds to that of the continuum image, the dotted ellipse to the molecular line data of this paper. Black triangles mark the positions where the spectra have been extracted for this work, and the white dotted circle shows the area with a radius of 0.′′ 5 where the spectra have been averaged.
Current usage metrics show cumulative count of Article Views (full-text article views including HTML views, PDF and ePub downloads, according to the available data) and Abstracts Views on Vision4Press platform.
Data correspond to usage on the plateform after 2015. The current usage metrics is available 48-96 hours after online publication and is updated daily on week days.
Initial download of the metrics may take a while.