Fig. 5.
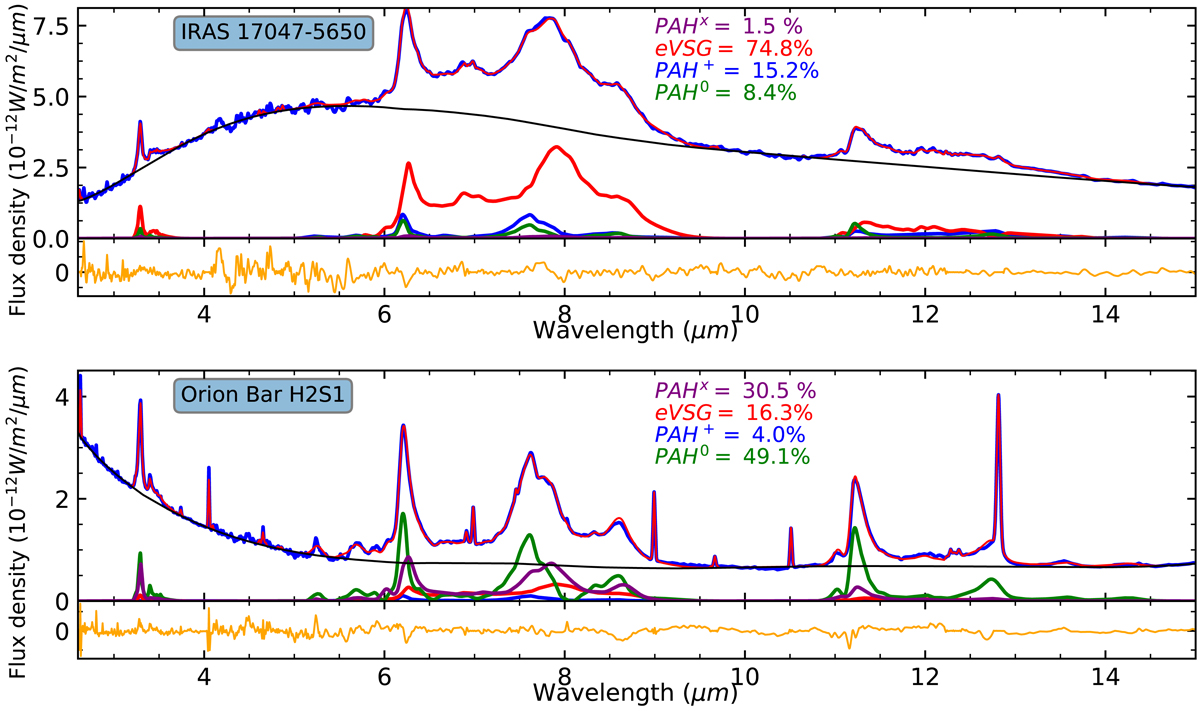
Two examples of spectral reconstruction of IRAS 17047−5650 (upper panel) and Orion Bar H2S1 (bottom panel). The thin black line shows the continuum, blue and red show respectively the data and the model. The four representative spectra for the eVSG, PAH+, PAH0 and PAHx populations are shown in red, blue, green, and purple for respectively.
Current usage metrics show cumulative count of Article Views (full-text article views including HTML views, PDF and ePub downloads, according to the available data) and Abstracts Views on Vision4Press platform.
Data correspond to usage on the plateform after 2015. The current usage metrics is available 48-96 hours after online publication and is updated daily on week days.
Initial download of the metrics may take a while.