Fig. E.1.
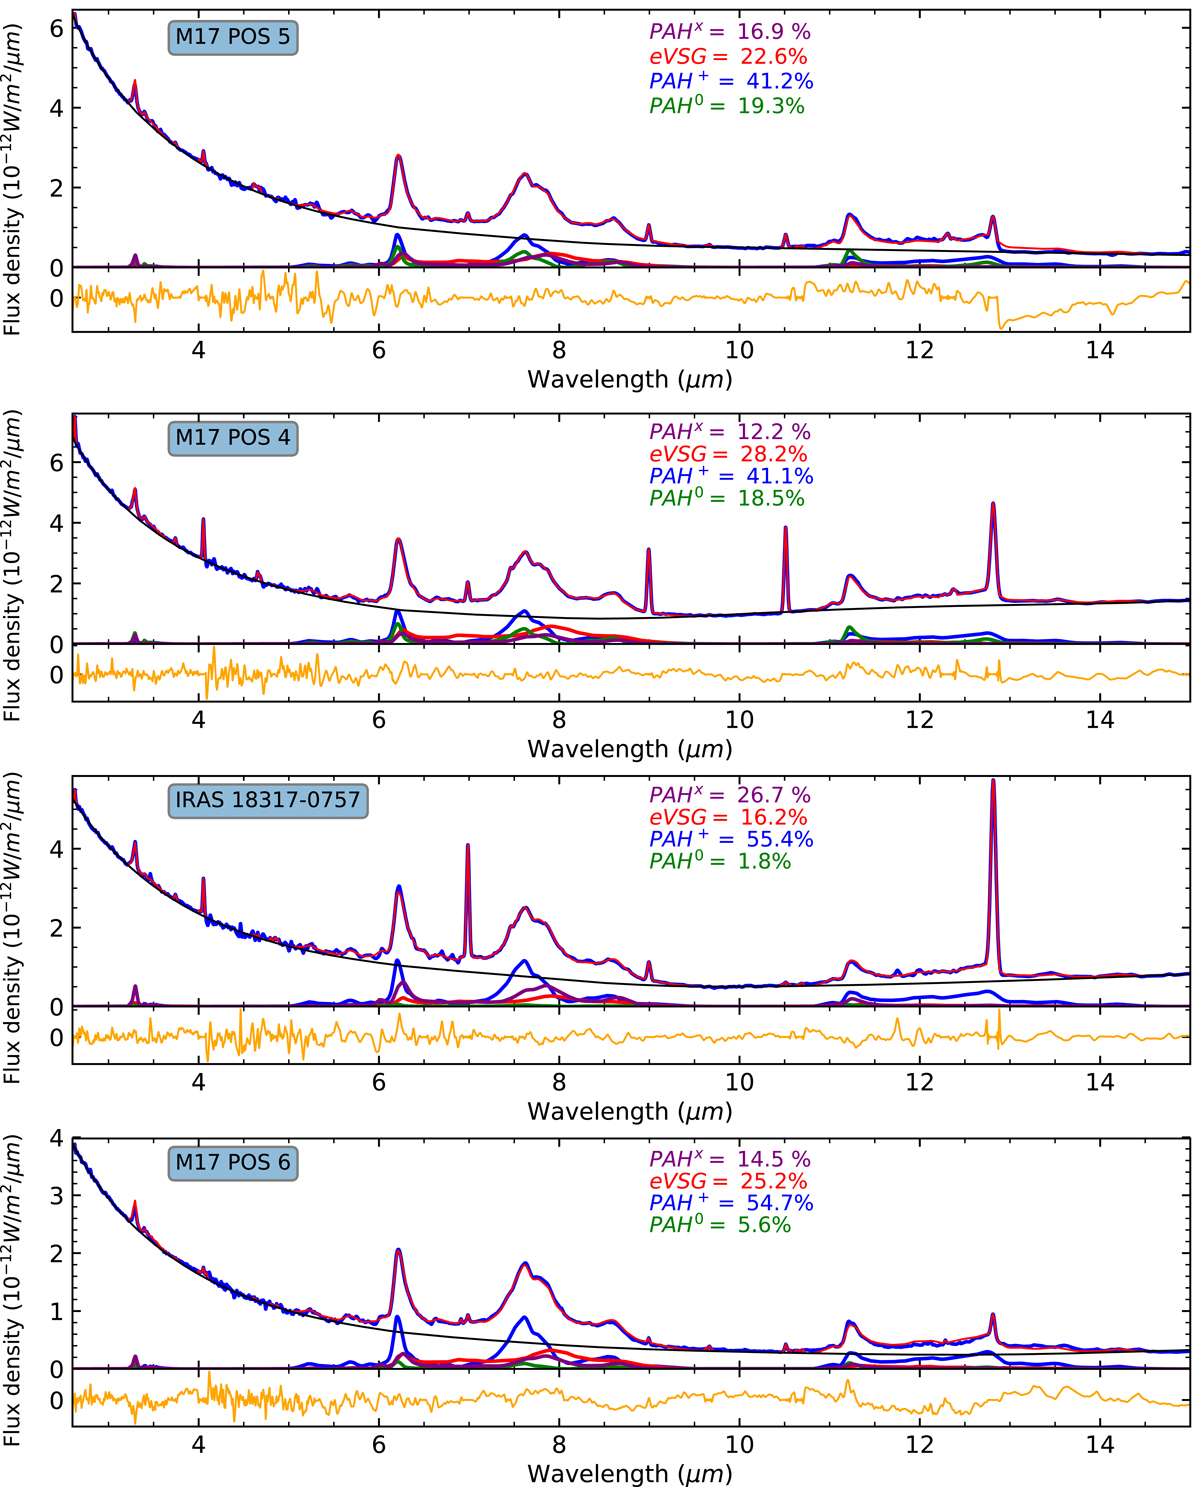
Reconstruction (in red, thin line) of the observed data (in blue), using the reconstruction method described in Sect. 3.2.2 based on the four representative spectra (Fig. 4). The relative contribution of each of these spectra is indicated. The black line corresponds to the continuum and orange to the residual of the reconstruction. The name of the corresponding astrophysical object is given in the blue box inside the plot.
Current usage metrics show cumulative count of Article Views (full-text article views including HTML views, PDF and ePub downloads, according to the available data) and Abstracts Views on Vision4Press platform.
Data correspond to usage on the plateform after 2015. The current usage metrics is available 48-96 hours after online publication and is updated daily on week days.
Initial download of the metrics may take a while.