Fig. 9.
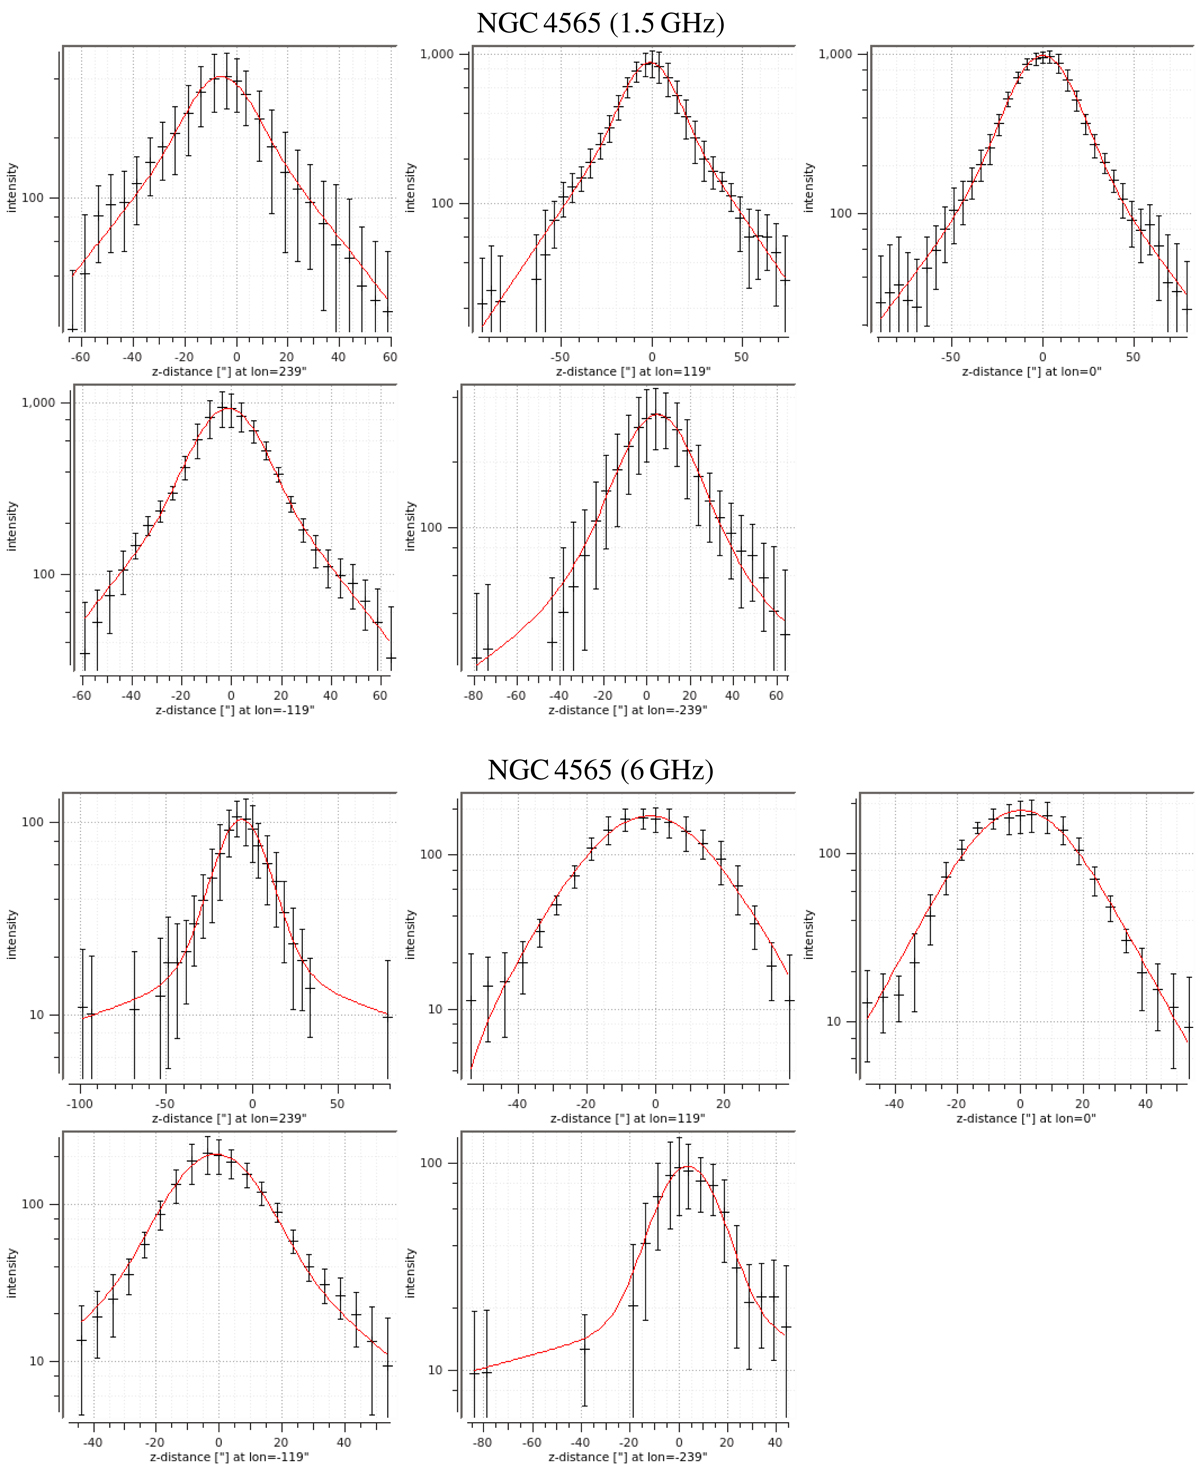
Vertical profiles of non-thermal intensity of NGC 4565 at 1.5 and 6 GHz as function of distance z to the galactic mid-plane, where positive z values are on the north side and negative ones on the south side of the mid-plane. The galactic longitude at the centre of each vertical strip is indicated below each sub-panel (1″ ≡ 58 pc). The data points correspond to the average intensity (in μJy beam−1) within each rectangular box defined with BoxModels. The solid lines denote two-component exponential least-squares fits to the data (see Appendix C). In a few cases we did not use the fits to the entire vertical profile (as shown here), but instead fitted the parts at positive and negative z separately and in each case adopted the mean value of the two resulting scale heights.
Current usage metrics show cumulative count of Article Views (full-text article views including HTML views, PDF and ePub downloads, according to the available data) and Abstracts Views on Vision4Press platform.
Data correspond to usage on the plateform after 2015. The current usage metrics is available 48-96 hours after online publication and is updated daily on week days.
Initial download of the metrics may take a while.