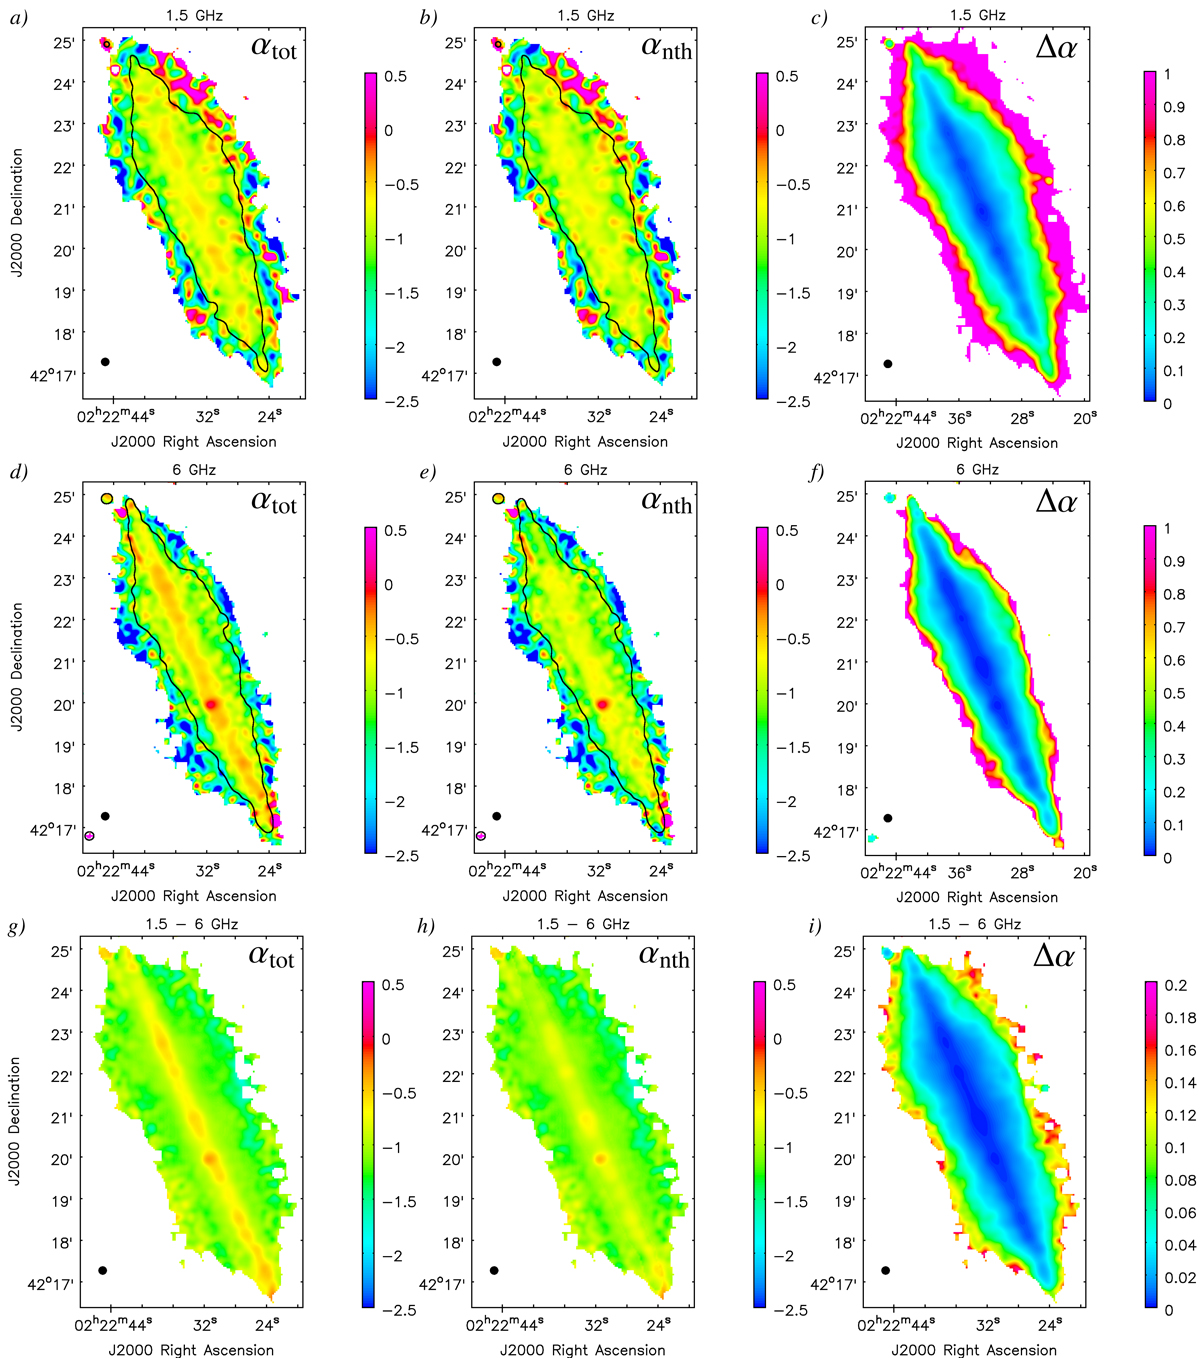
Fig. 6.

Short-spacing corrected spectral index maps of NGC 891 and corresponding error maps. a: 1.5 GHz in-band total spectral index. b: 1.5 GHz in-band non-thermal spectral index. c: 1.5 GHz in-band spectral index error. d: 6 GHz in-band total spectral index. e: 6 GHz in-band non-thermal spectral index. f: 6 GHz in-band spectral index error. g: Total spectral index between 1.5 and 6 GHz. h: Non-thermal spectral index between 1.5 and 6 GHz. i: Error of spectral index between 1.5 and 6 GHz. The angular resolution in each panel is 12″ FWHM (black circles). All maps extend to the 5σ level in the corresponding total intensity images. The black contours in the in-band maps are placed at the 30σ level, where the maps were cut off before creating the scatter plot in Fig. 14a; see text for details.
Current usage metrics show cumulative count of Article Views (full-text article views including HTML views, PDF and ePub downloads, according to the available data) and Abstracts Views on Vision4Press platform.
Data correspond to usage on the plateform after 2015. The current usage metrics is available 48-96 hours after online publication and is updated daily on week days.
Initial download of the metrics may take a while.


