Fig. 5.
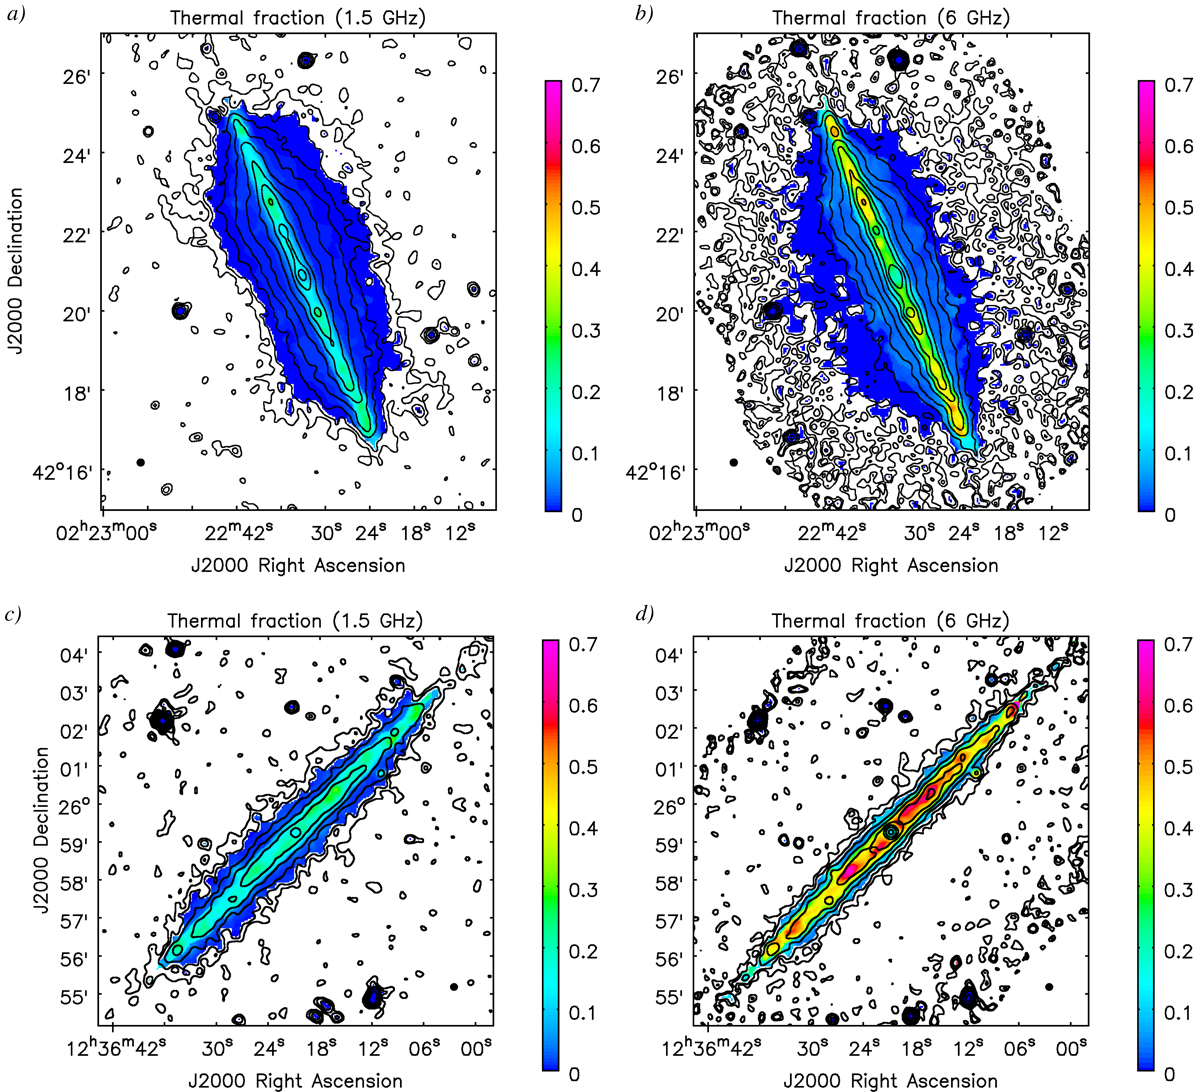
Fraction of thermal radio continuum emission in NGC 891 and 4565 at 1.5 and 6 GHz. The angular resolution in all panels is 12″. Each map is overlaid with contours of the total radio emission at the respective frequency, identical to those shown in shown in Figs. 3a and b and Figs. 4a and b, respectively. Contour levels are σ × (3, 6, 12, 24, etc) of the corresponding total emission maps (see Tables 2 and 3). Filled black circles indicate the size of the synthesised beam.
Current usage metrics show cumulative count of Article Views (full-text article views including HTML views, PDF and ePub downloads, according to the available data) and Abstracts Views on Vision4Press platform.
Data correspond to usage on the plateform after 2015. The current usage metrics is available 48-96 hours after online publication and is updated daily on week days.
Initial download of the metrics may take a while.