Fig. D.6.
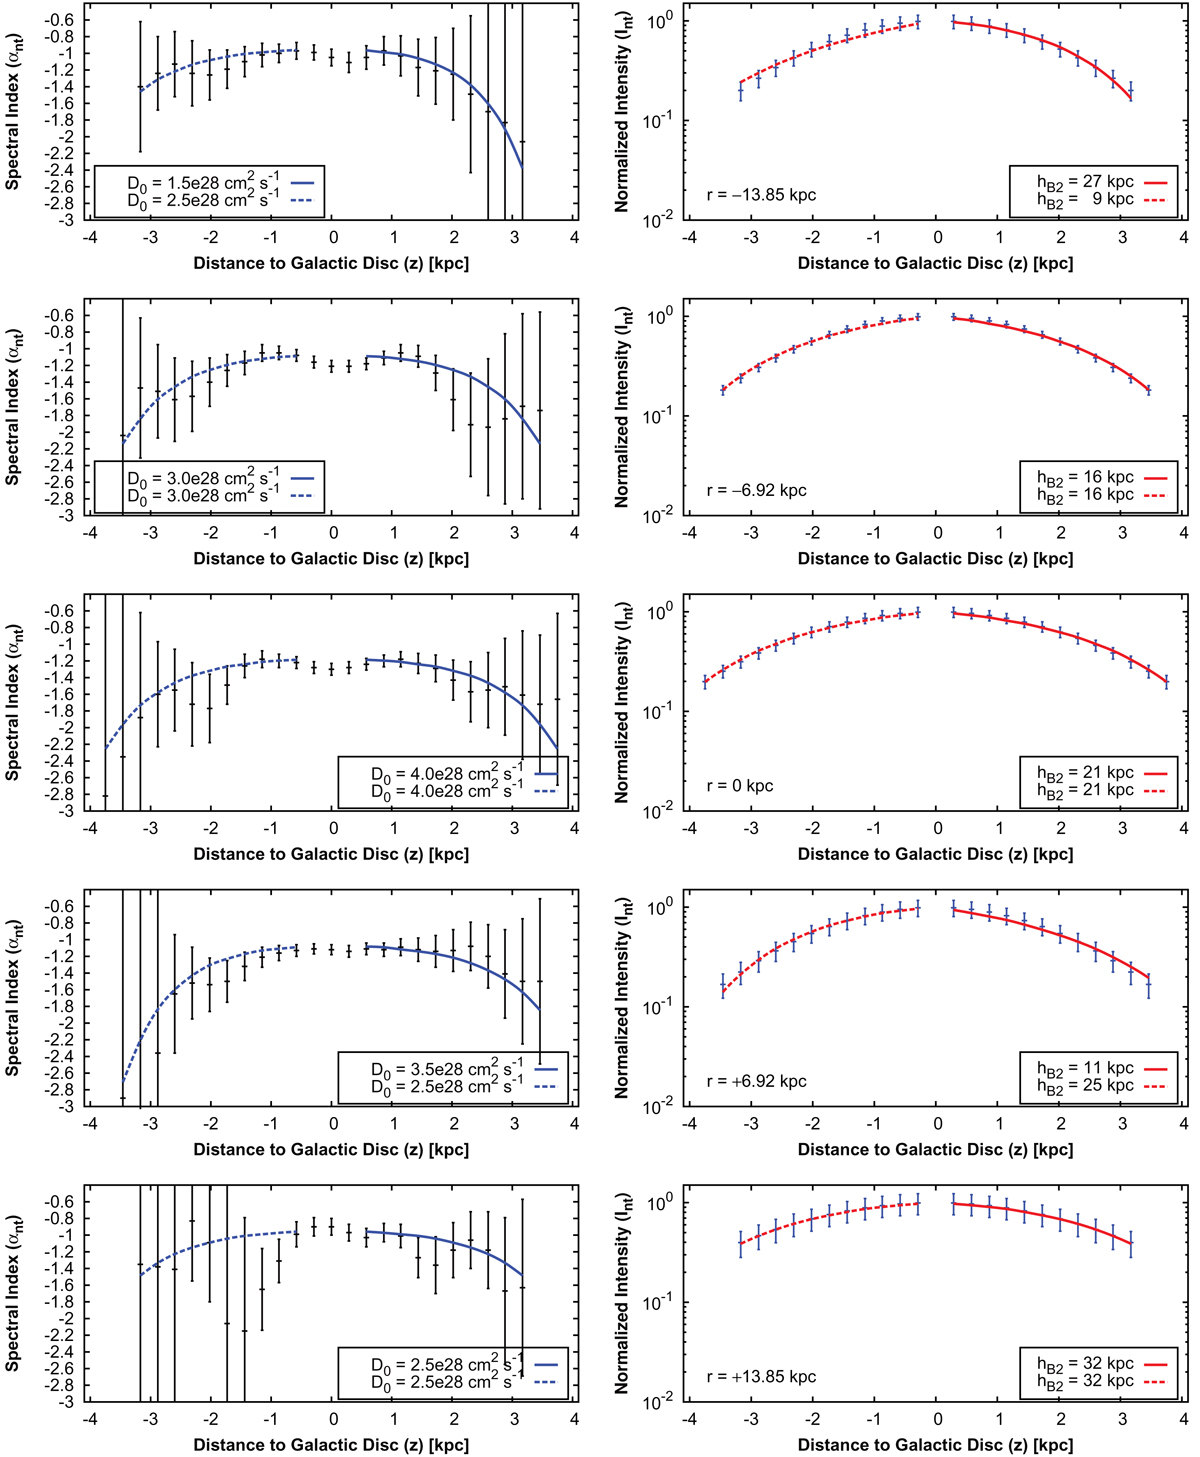
Diffusion models with an energy-dependent diffusion coefficient [D(E) = D0(E/1 GeV)μ] for NGC 4565 (assuming μ = 0.3). Data points denote the vertical profile of the non-thermal spectral index between 1.5 and 6 GHz (left panels) and the Gaussian model of the non-thermal intensity profile at 1.5 GHz (right panels). The radial position of each profile is given in the right-hand-side plot; r < 0 is east of the minor axis and r > 0 is west of the minor axis. Positive z values are on the north side and negative ones on the south side of the mid-plane. Solid lines show the best-fitting diffusion models.
Current usage metrics show cumulative count of Article Views (full-text article views including HTML views, PDF and ePub downloads, according to the available data) and Abstracts Views on Vision4Press platform.
Data correspond to usage on the plateform after 2015. The current usage metrics is available 48-96 hours after online publication and is updated daily on week days.
Initial download of the metrics may take a while.