Fig. 14.
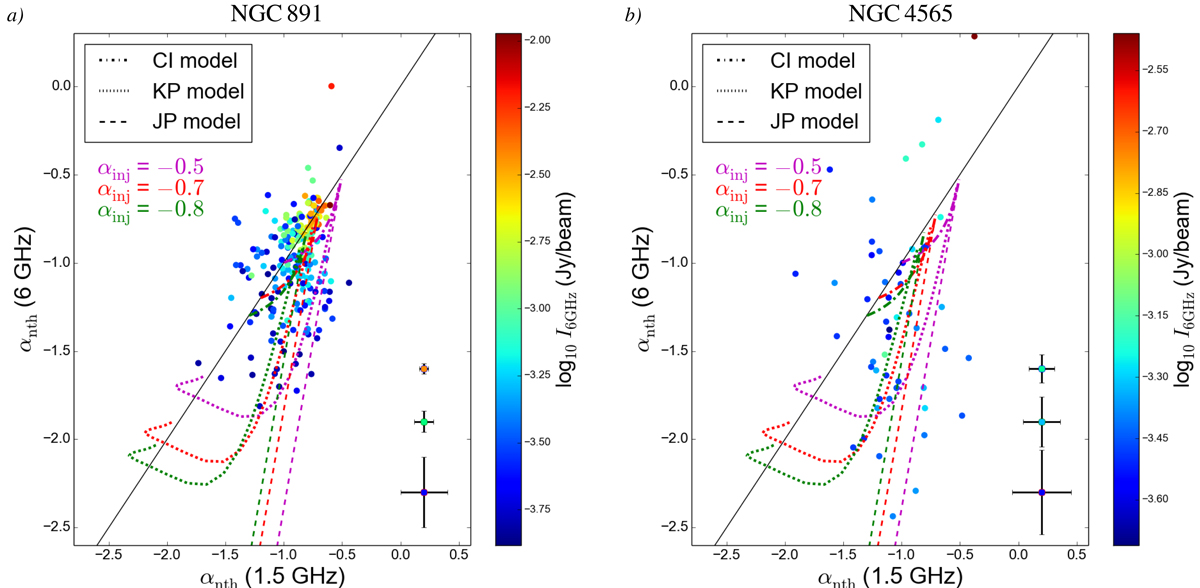
Scatter plots of the non-thermal in-band spectral index distributions (6 GHz vs. 1.5 GHz; both are equal along the solid black line), in comparison to different spectral ageing models. a: NGC 891 (Fig. 6b vs. Fig. 6e). b: NGC 4565 (Fig. 7b vs. Fig. 7e). All αnth maps were cut off at 30σ (NGC 891) or 20σ (NGC 4565) of the respective total intensity maps. Each data point represents the 1.5 and 6 GHz spectral index averaged within one synthesised beam and is colour-coded based on the 6 GHz total intensity map (Figs. 3b and 4b). The dash-dotted, dotted, and dashed lines show the expected positions in the plot for the CI, KP, and JP models, respectively, for different break frequencies νbr and three different injection spectral indices αinj. The symbols with error bars represent the Δα maps (panels c and f of Figs. 6 and 7) and are shown for three different intensity values.
Current usage metrics show cumulative count of Article Views (full-text article views including HTML views, PDF and ePub downloads, according to the available data) and Abstracts Views on Vision4Press platform.
Data correspond to usage on the plateform after 2015. The current usage metrics is available 48-96 hours after online publication and is updated daily on week days.
Initial download of the metrics may take a while.