Fig. 1.
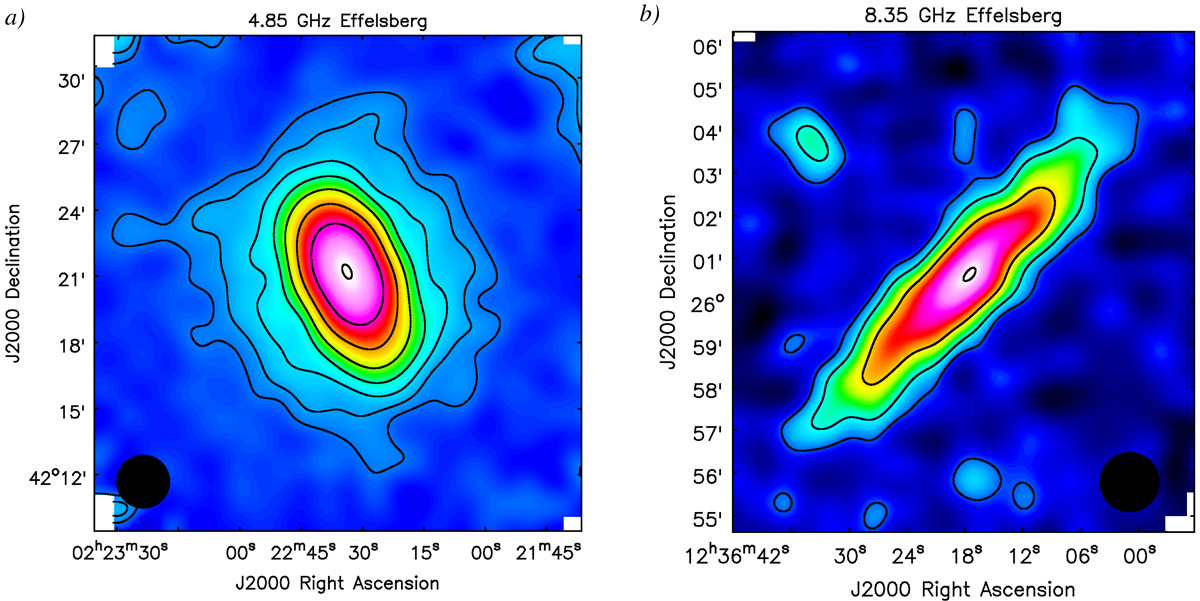
a: Effelsberg map of the total intensity distribution of NGC 891 at 4.85 GHz (FWHM of the synthesised beam: 147″, rms noise: σ = 325 μJy beam−1). b: Effelsberg map of the total intensity distribution of NGC 4565 at 8.35 GHz (FWHM of the synthesised beam: ![]() , rms noise: σ = 260 μJy beam−1). Contour levels in both maps are σ × (3, 6, 12, 24, etc). Filled black circles indicate the size of the synthesised beam.
, rms noise: σ = 260 μJy beam−1). Contour levels in both maps are σ × (3, 6, 12, 24, etc). Filled black circles indicate the size of the synthesised beam.
Current usage metrics show cumulative count of Article Views (full-text article views including HTML views, PDF and ePub downloads, according to the available data) and Abstracts Views on Vision4Press platform.
Data correspond to usage on the plateform after 2015. The current usage metrics is available 48-96 hours after online publication and is updated daily on week days.
Initial download of the metrics may take a while.