Free Access
Fig. 8.
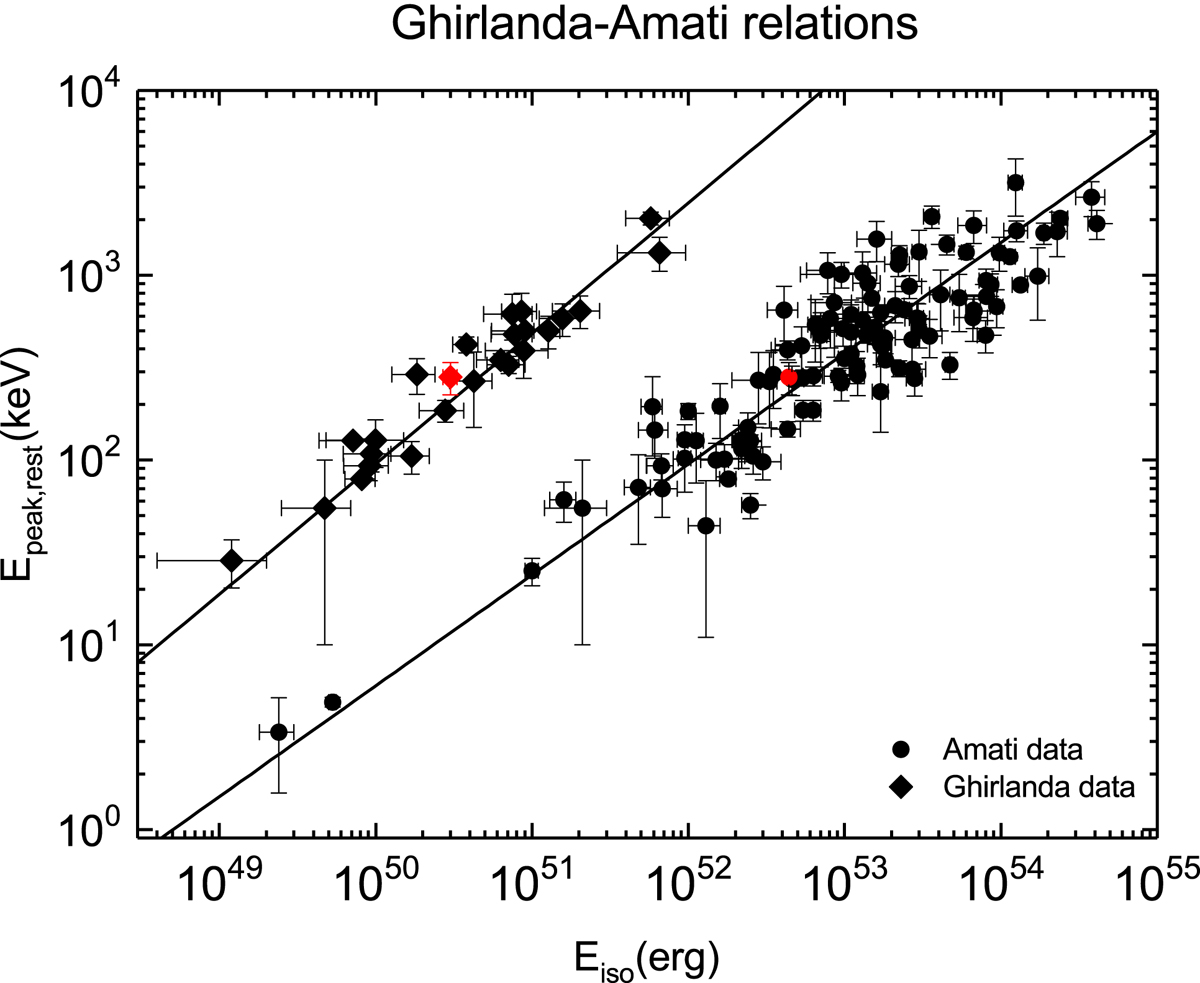
Location of GRB 140629A (red point) with the Ghirlanda (black prism) and Amati relation (black circle) derived from other typical GRBs (data from Ghirlanda et al. 2007; Amati et al. 2008, 2009). The two straight lines indicate the two empirical relations.
Current usage metrics show cumulative count of Article Views (full-text article views including HTML views, PDF and ePub downloads, according to the available data) and Abstracts Views on Vision4Press platform.
Data correspond to usage on the plateform after 2015. The current usage metrics is available 48-96 hours after online publication and is updated daily on week days.
Initial download of the metrics may take a while.