Fig. 7.
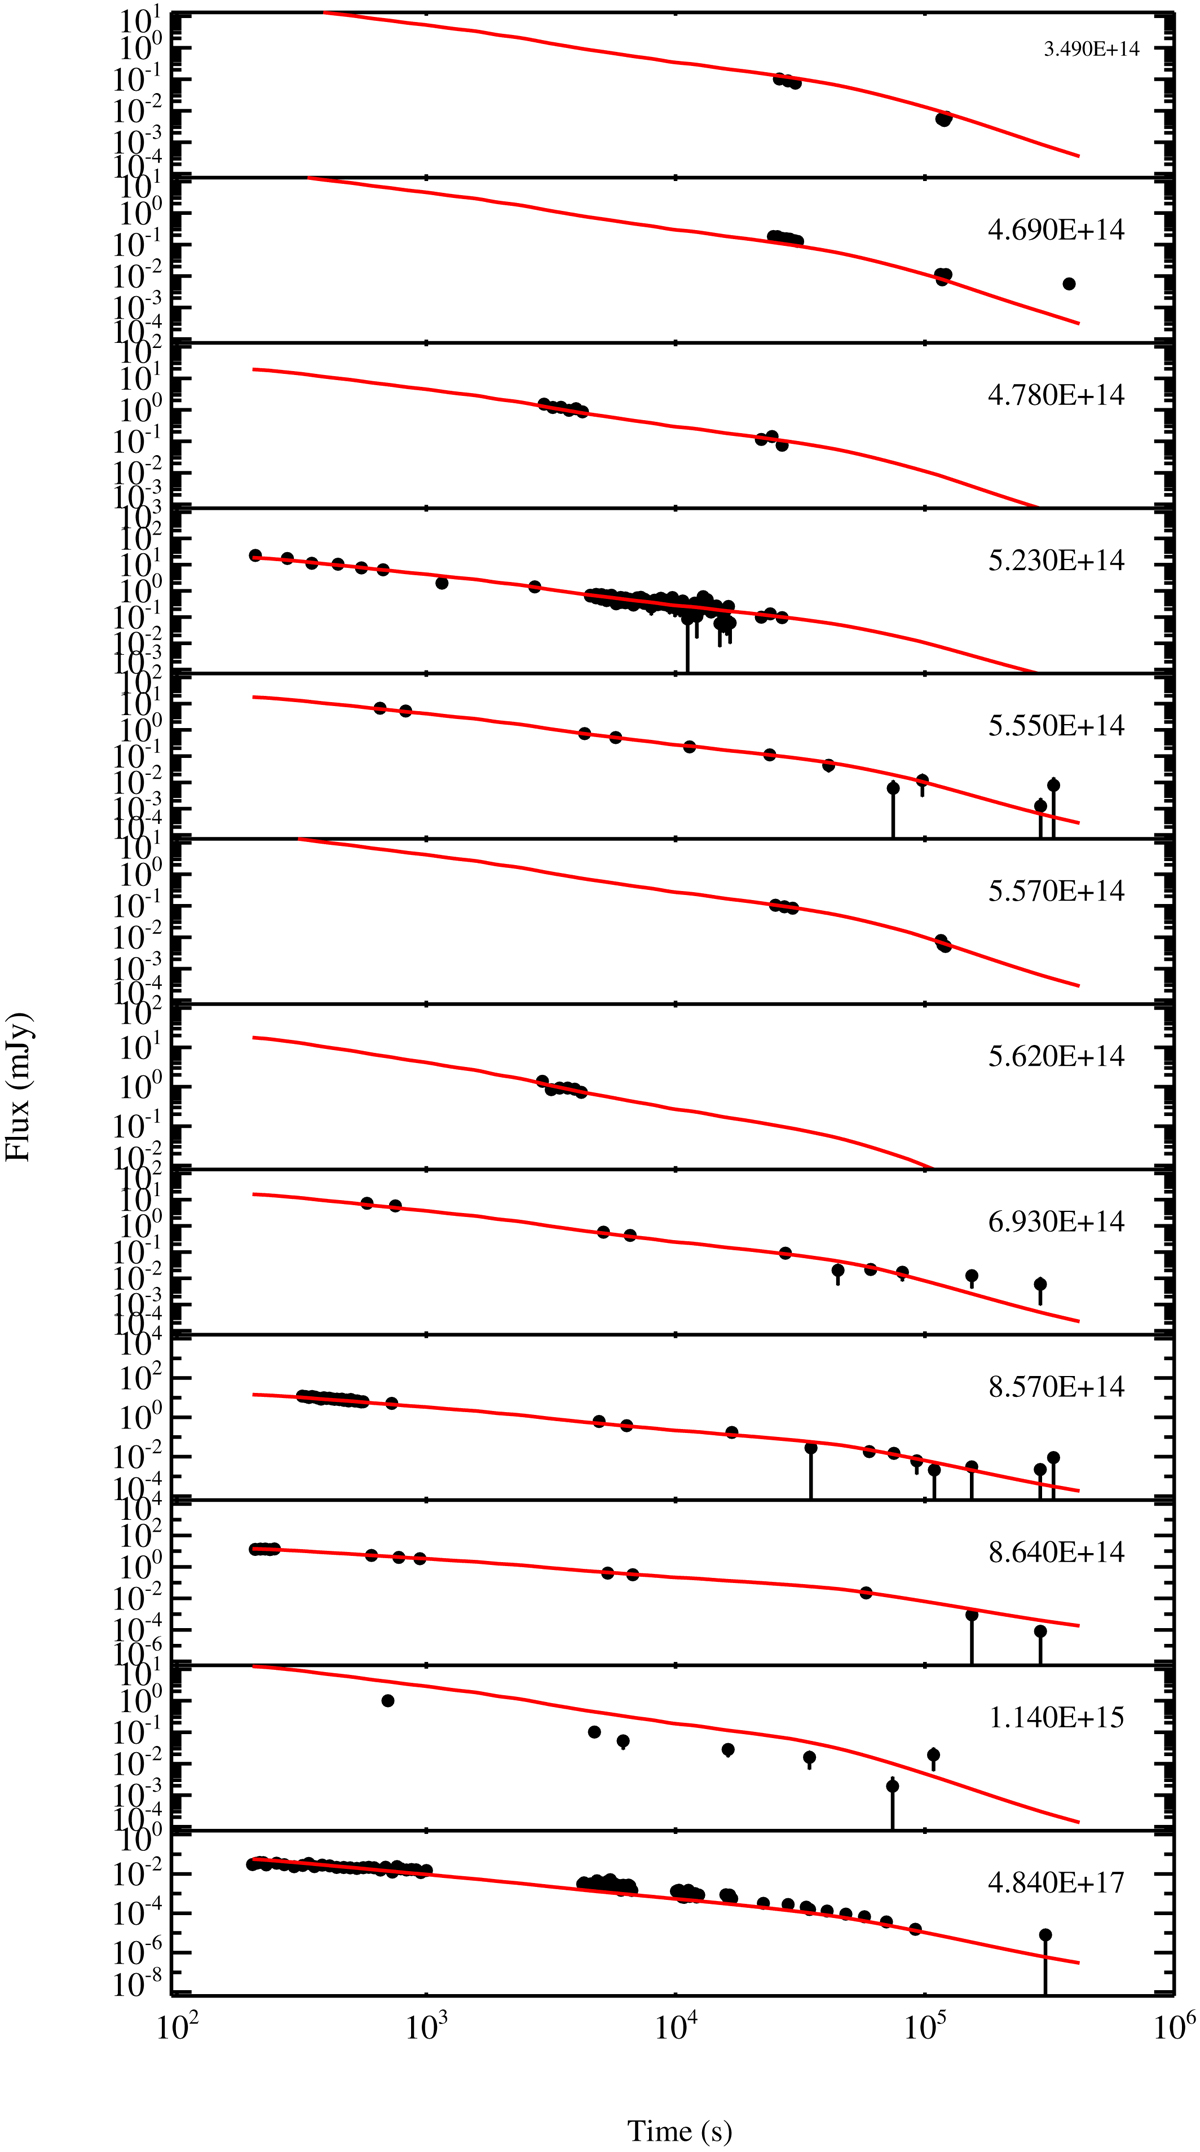
Best fit model determined from the numerical simulations overlaid on the observations at different wavelengths. The corresponding frequency is shown on the right corner in each panel in unit of Hz. The x-axis is the time since trigger in units of seconds. The observed flux density of each instrument is indicated on the y-axis in units of mJy. All data were corrected for MW and host galaxy absorption and extinction effects before modelling. Red solid lines represent the modelled light curves.
Current usage metrics show cumulative count of Article Views (full-text article views including HTML views, PDF and ePub downloads, according to the available data) and Abstracts Views on Vision4Press platform.
Data correspond to usage on the plateform after 2015. The current usage metrics is available 48-96 hours after online publication and is updated daily on week days.
Initial download of the metrics may take a while.