Fig. 5.
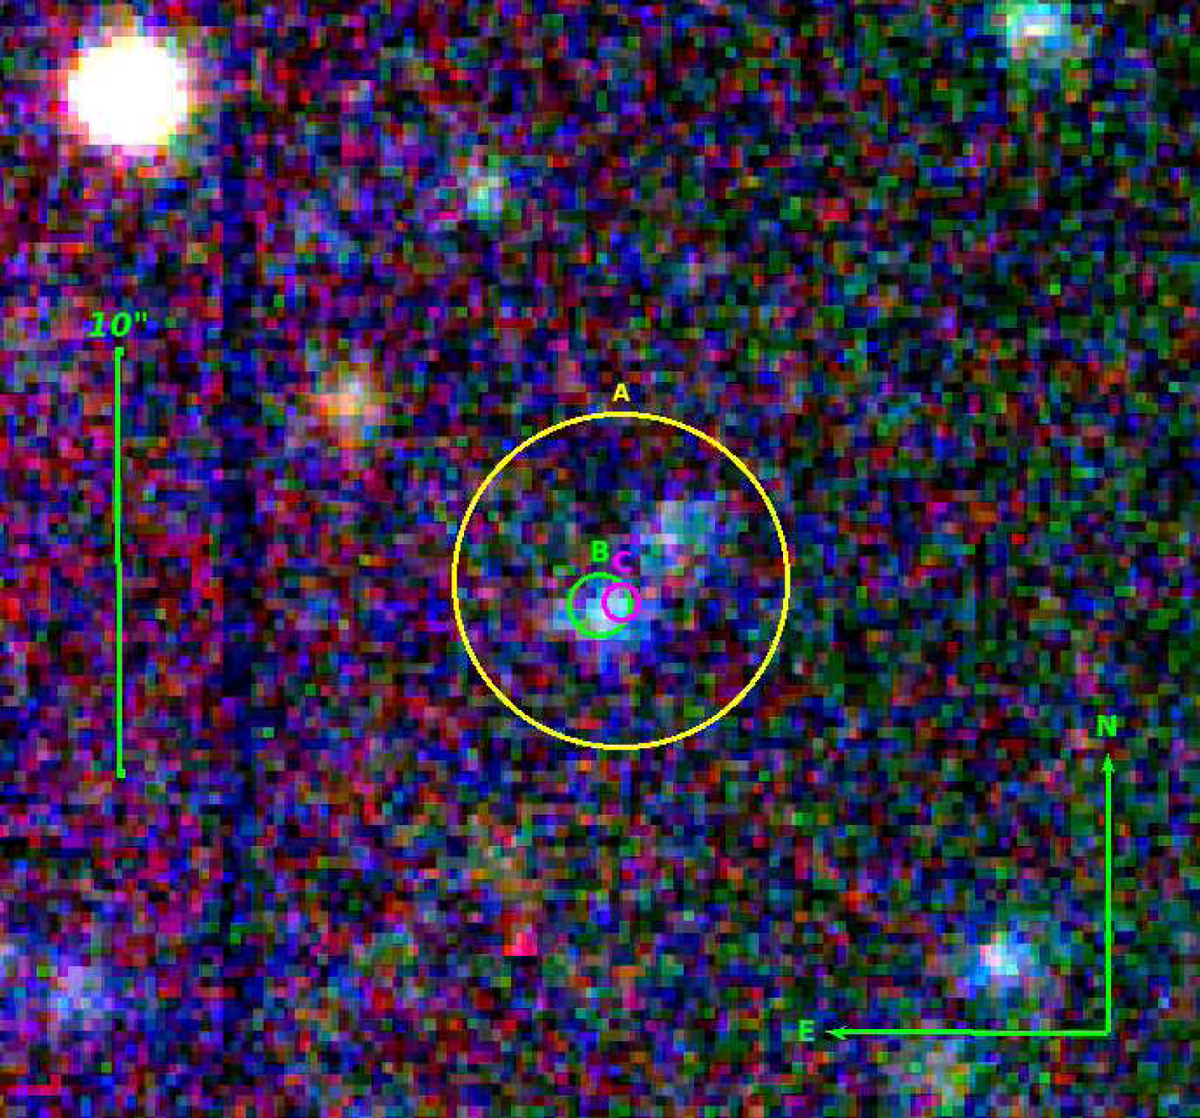
Sloan gri-bands false colour image of the field of GRB 140629A taken with the 10.4 m GTC on July 2, 2017. Circle A (yellow dash circle) represents the 4 arcsec radius error circle of the XRT. The circle B (green circle) and C (pink circle) represent the UVOT observation in 0.74 arcsec and 0.42 arcsec, respectively (Lien et al. 2014; Breeveld & Lien 2014). The host galaxy is clearly found at the burst location which looks interacting with the nearby galaxy. North is up and east to the left.
Current usage metrics show cumulative count of Article Views (full-text article views including HTML views, PDF and ePub downloads, according to the available data) and Abstracts Views on Vision4Press platform.
Data correspond to usage on the plateform after 2015. The current usage metrics is available 48-96 hours after online publication and is updated daily on week days.
Initial download of the metrics may take a while.