Free Access
Fig. 3.
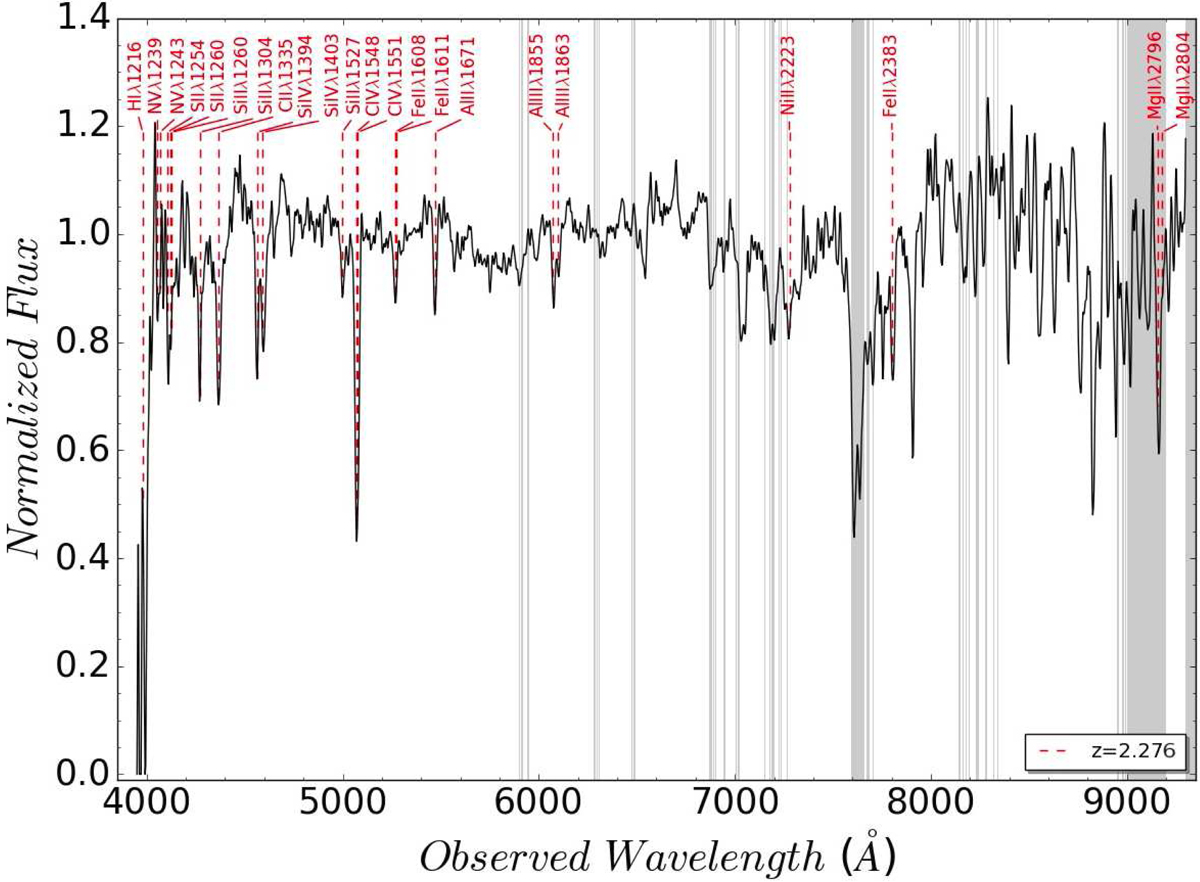
Overall view of the optical spectrum from BTA, obtained ∼4.1 h after the GRB 140629A trigger. These metal lines of the absorption system in the GRB host galaxy are labelled in red, showing the corresponding transitions. The wavelength range with strong telluric absorption features are indicated by grey vertical lines.
Current usage metrics show cumulative count of Article Views (full-text article views including HTML views, PDF and ePub downloads, according to the available data) and Abstracts Views on Vision4Press platform.
Data correspond to usage on the plateform after 2015. The current usage metrics is available 48-96 hours after online publication and is updated daily on week days.
Initial download of the metrics may take a while.