Free Access
Fig. 2.
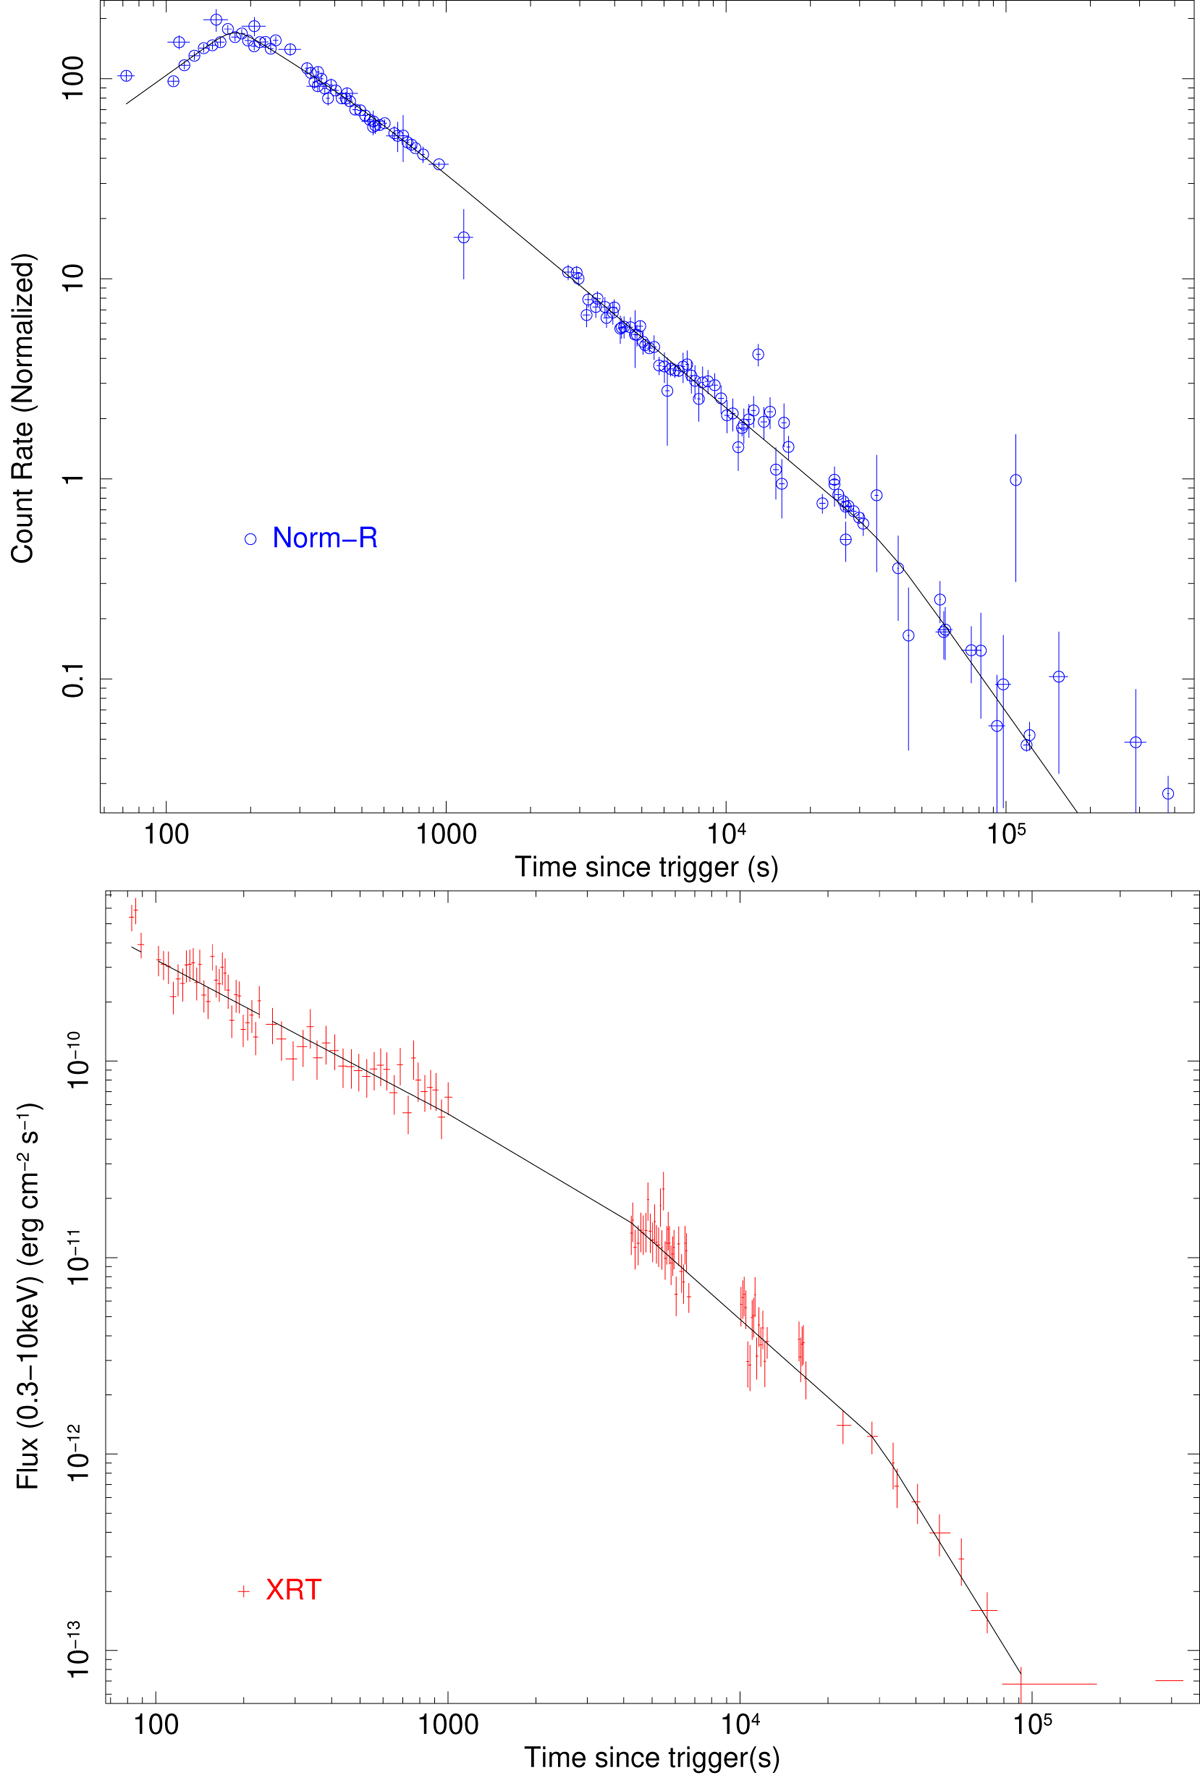
Fitting of the X-ray and optical GRB 140629A data. The normalised optical data are shown on the top panel with blue circles. The X-ray data are plotted on the bottom panel with red crosses. The black lines indicate the fitting results.
Current usage metrics show cumulative count of Article Views (full-text article views including HTML views, PDF and ePub downloads, according to the available data) and Abstracts Views on Vision4Press platform.
Data correspond to usage on the plateform after 2015. The current usage metrics is available 48-96 hours after online publication and is updated daily on week days.
Initial download of the metrics may take a while.