Free Access
Fig. 1.
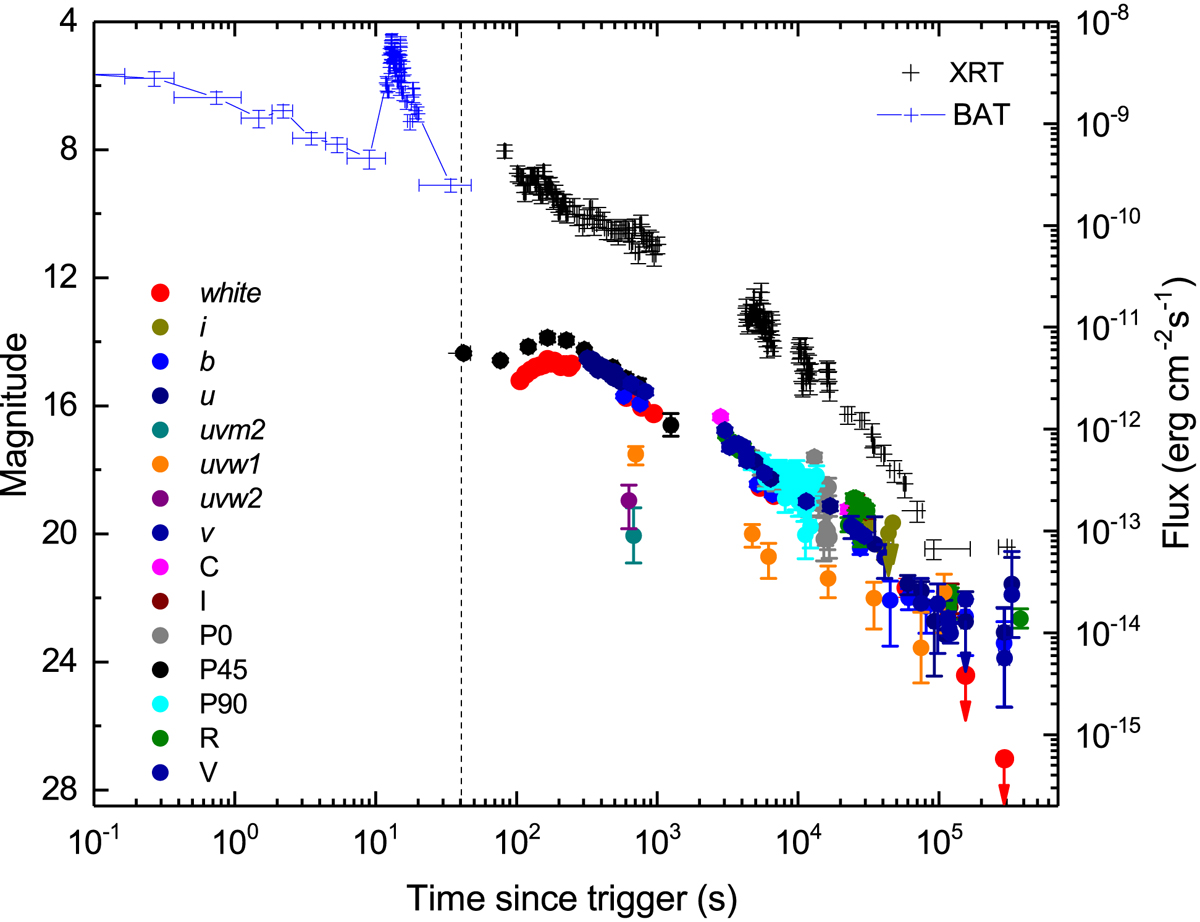
X-ray and optical light curves for GRB 140629A. Observations from both BAT and XRT are given with blue crosses and black crosses, respectively. The BAT data are normalised to the same energy range as XRT. The optical data are shown with circles. The vertical dash line indicates the end of the prompt emission, given by T90.
Current usage metrics show cumulative count of Article Views (full-text article views including HTML views, PDF and ePub downloads, according to the available data) and Abstracts Views on Vision4Press platform.
Data correspond to usage on the plateform after 2015. The current usage metrics is available 48-96 hours after online publication and is updated daily on week days.
Initial download of the metrics may take a while.