Fig. 5.
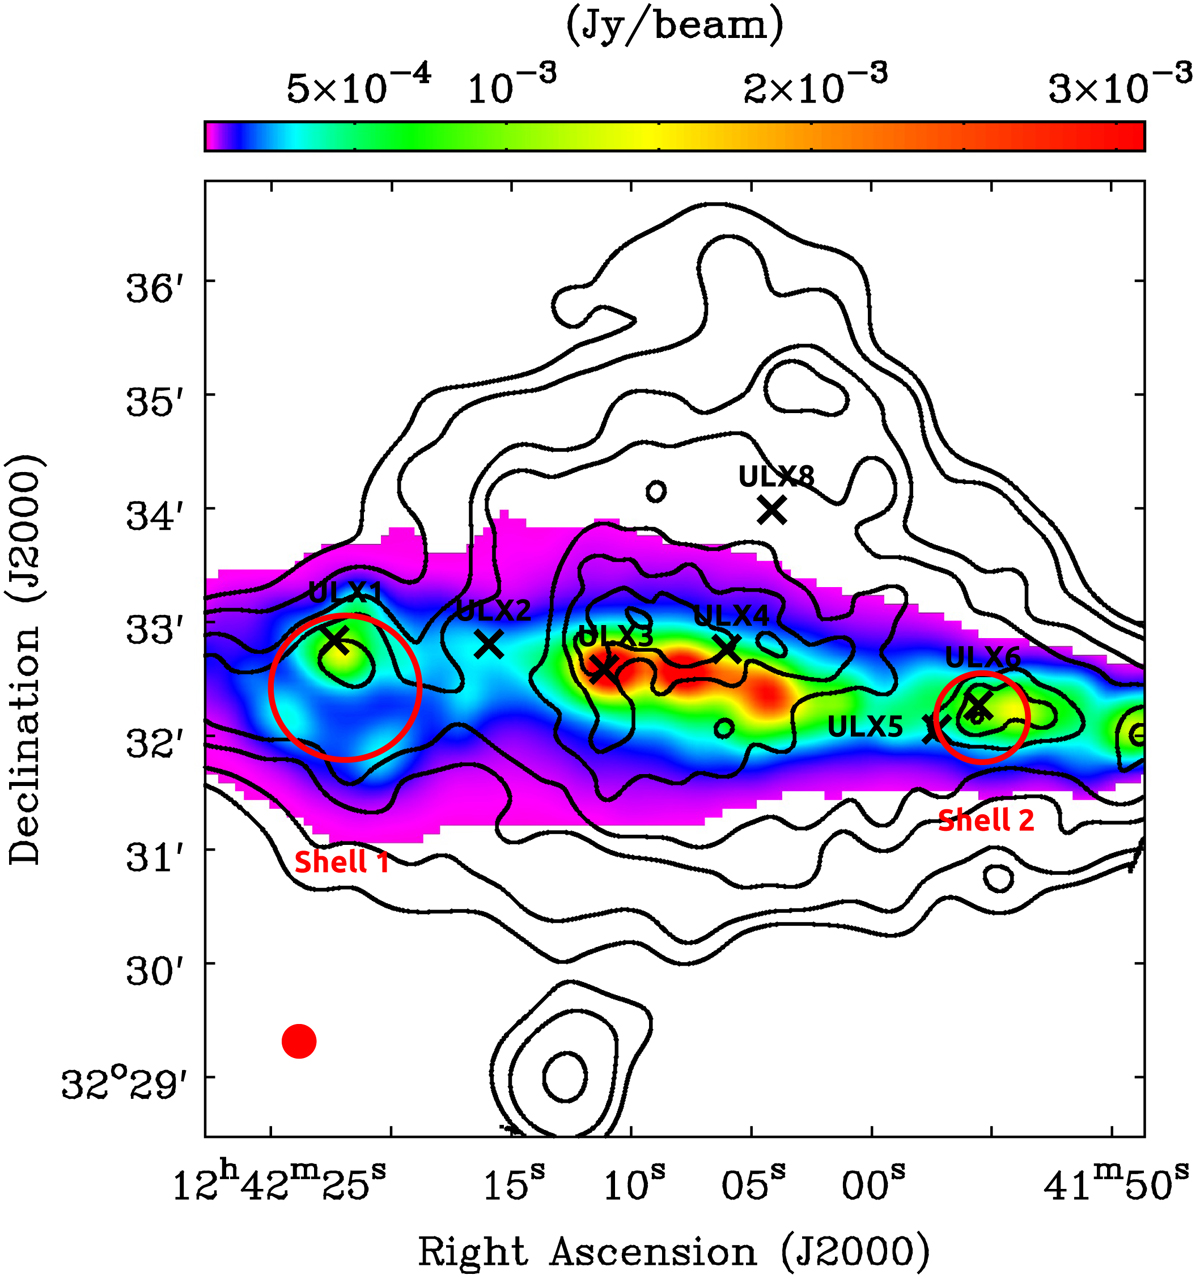
Colorscale of thermal emission at 5.99 GHz estimated from combination of Hα and 24 μm data (18″ FWHM). Contours correspond to the soft X-ray emission (0.3–1.5 keV) from Wang et al. (2001). The brightest X-ray sources (Vogler & Pietsch 1996; Read et al. 1997; Soria & Ghosh 2009) are marked by X-symbols and the red circles represent the approximate size of the H I supershells (Rand & van der Hulst 1993).
Current usage metrics show cumulative count of Article Views (full-text article views including HTML views, PDF and ePub downloads, according to the available data) and Abstracts Views on Vision4Press platform.
Data correspond to usage on the plateform after 2015. The current usage metrics is available 48-96 hours after online publication and is updated daily on week days.
Initial download of the metrics may take a while.