Fig. 4.
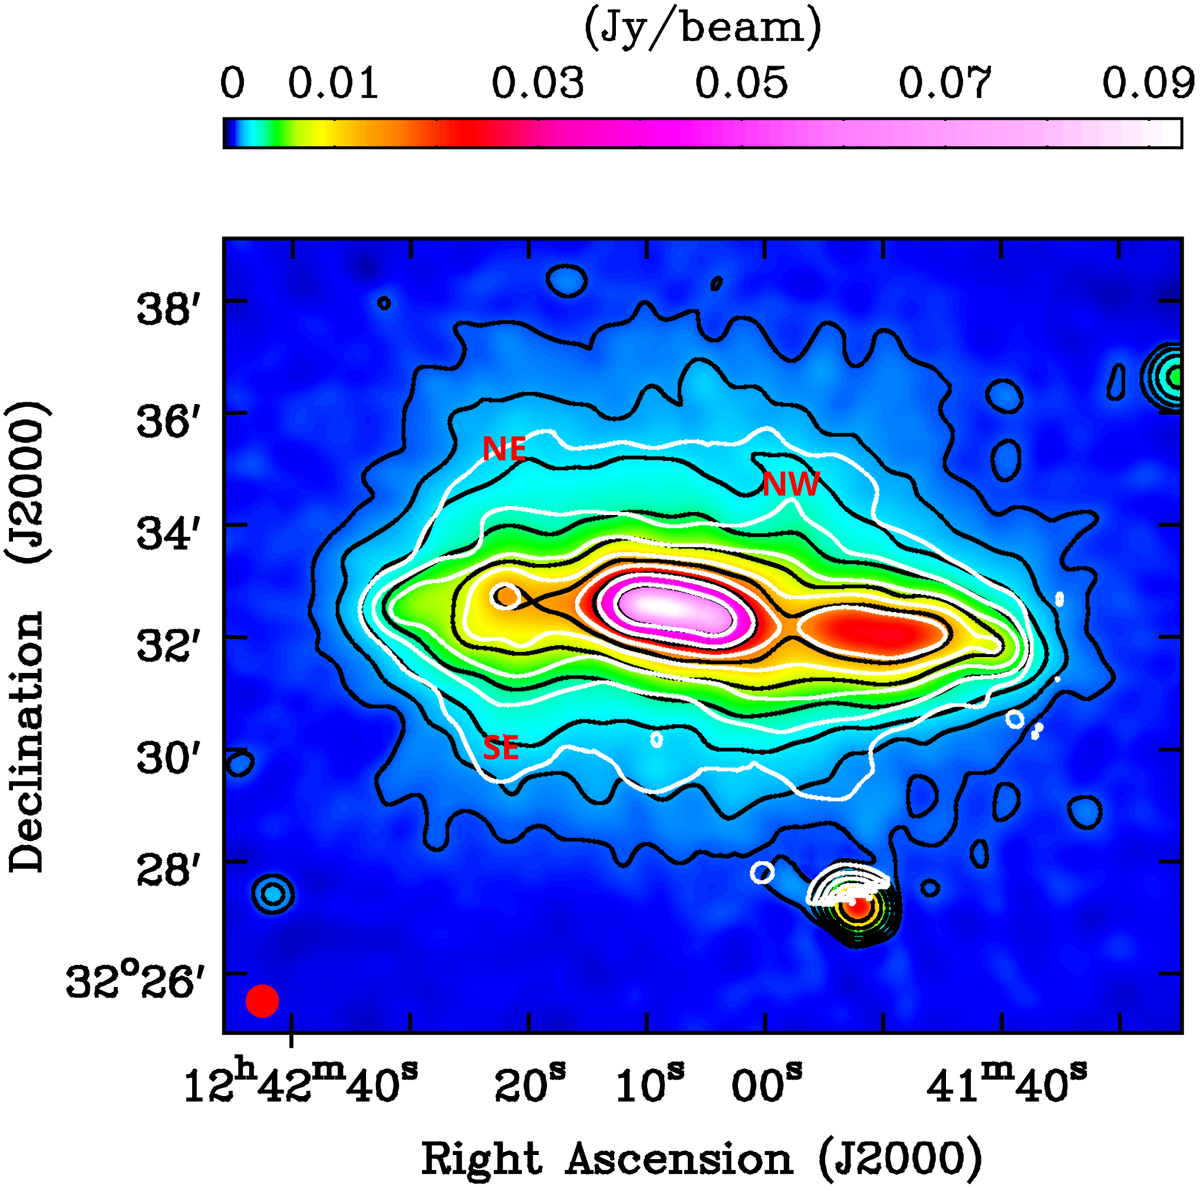
Radio spurs observed at frequency of 1.57 and 5.99 GHz. The colorscale represents the 1.57 GHz emission (VLA + Effelsberg). White contours correspond to the 5.99 GHz emission (VLA + Effelsberg) are at 110 μJy beam−1 × (3, 6, 12, 24, 48, 96, 192, 384). Black contours correspond to the 1.57 GHz radiation (VLA + Effelsberg) are at 140 μJy beam−1 × (3, 6, 12, 24, 48, 96, 192, 384). All data plotted have an angular resolution of 35″ FWHM. The SE-radio spur (SE), NE-radio spur (NE), and NW-radio spur (NW) have been indicated in the map. The total power map at 5.99 GHz is truncated in the southern part of the galaxy due to the primary beam.
Current usage metrics show cumulative count of Article Views (full-text article views including HTML views, PDF and ePub downloads, according to the available data) and Abstracts Views on Vision4Press platform.
Data correspond to usage on the plateform after 2015. The current usage metrics is available 48-96 hours after online publication and is updated daily on week days.
Initial download of the metrics may take a while.