Fig. 10.
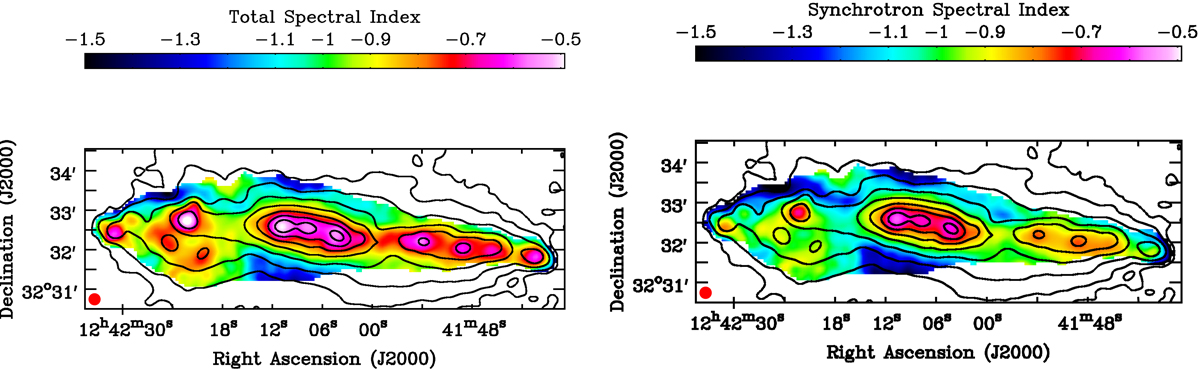
Left panel: total spectral index distribution (in color) between 1.57 and 5.99 GHz data (VLA + Effelsberg). Right panel: synchrotron spectral index distribution (in color) derived between 1.57 and 5.99 GHz data (VLA + Effelsberg). In both figures, values were calculated at pixels where the Hα emission and total power are larger than 3σ. All data plotted have an angular resolution of 18″ FWHM. Contour levels corresponding to the 5.99 GHz total power emission (VLA + Effelsberg) are at 35 μJy beam−1 × (3, 6, 12, 24, 48, 96, 192, 384).
Current usage metrics show cumulative count of Article Views (full-text article views including HTML views, PDF and ePub downloads, according to the available data) and Abstracts Views on Vision4Press platform.
Data correspond to usage on the plateform after 2015. The current usage metrics is available 48-96 hours after online publication and is updated daily on week days.
Initial download of the metrics may take a while.