Fig. A.1.
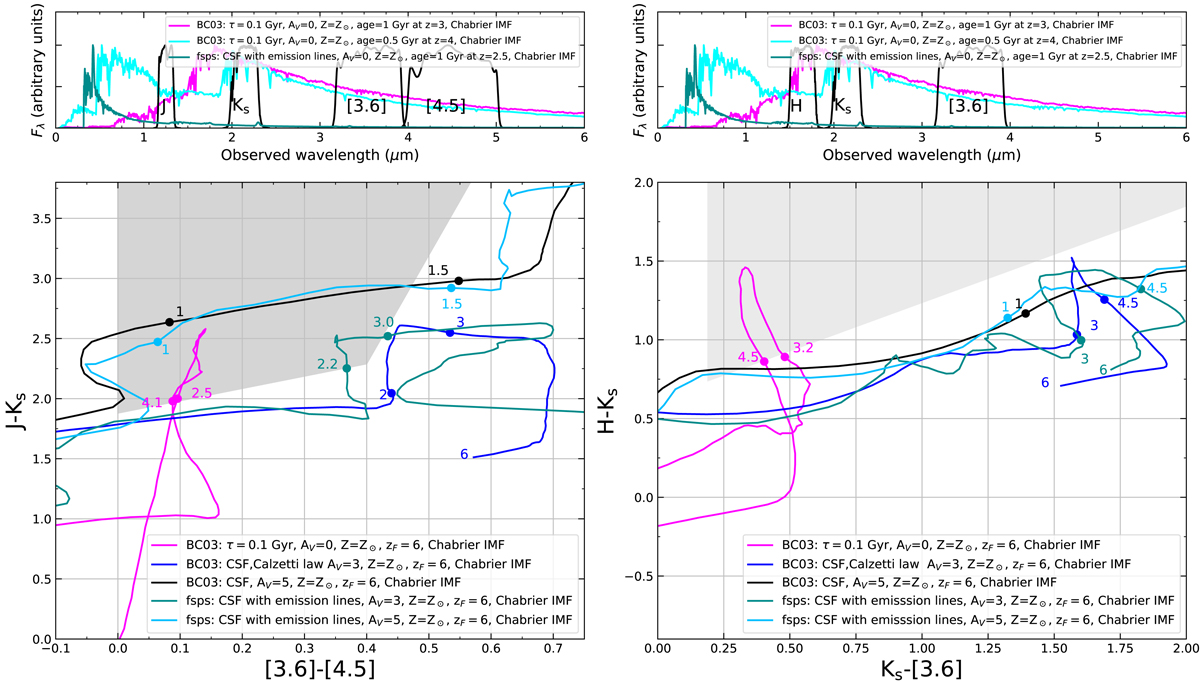
Effect of emission lines on JKs[3.6][4.5] and HKs[3.6] color–color diagrams. Top panels: two SEDs of quiescent galaxies (magenta and cyan lines), representing a population 1 Gyr old redshifted to z = 3 and a population 0.5 Gyr old redshifted to z = 4 (i.e., zform ≈ 6) built with BC03 models. A star forming SED with emission lines built from fsps, 1 Gyr old and redshifted to z = 2.5 is shown in dark-cyan. Also the filters transmission curves, used in COSMOS field and in the tracks computation, are shown. Bottom: evolution in color–color plots for star-forming and passive galaxies. Tracks representing star-forming galaxies are shown in blue, black dark-cyan, and cyan, and their characteristics are shown in the legend inside the plot. A track for quiescent galaxies (with e-folding time of τ = 0.1 Gyr and solar metallicity) is shown in magenta.
Current usage metrics show cumulative count of Article Views (full-text article views including HTML views, PDF and ePub downloads, according to the available data) and Abstracts Views on Vision4Press platform.
Data correspond to usage on the plateform after 2015. The current usage metrics is available 48-96 hours after online publication and is updated daily on week days.
Initial download of the metrics may take a while.