Fig. 7.
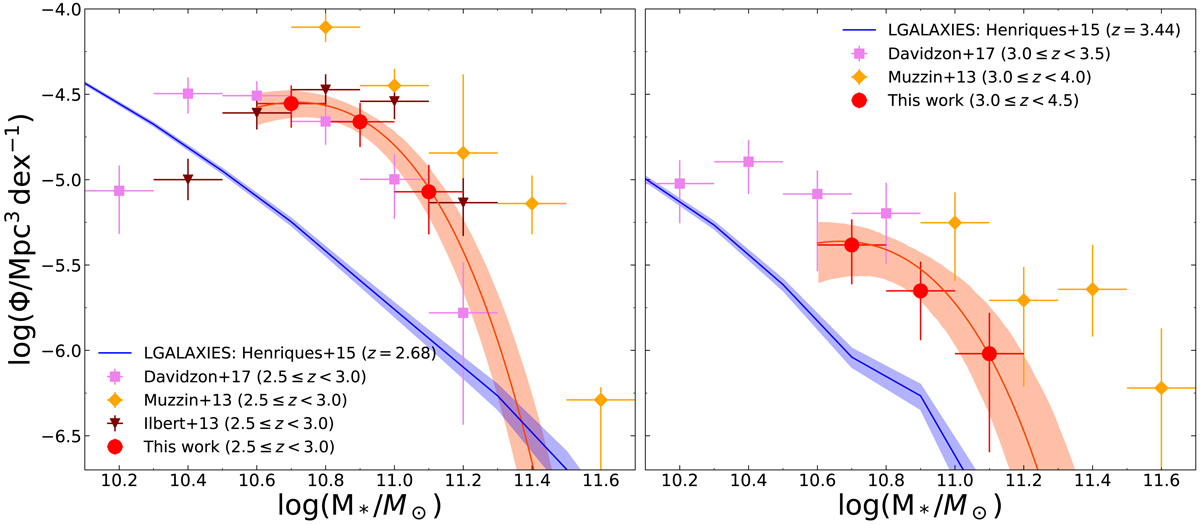
Stellar mass function of extended galaxies, in two redshift bins between z = 2.5 and 4.5. In each panel, the data points are shown as red circles in bins of Δlog M/M⊙ = 0.1. Error bars include Poisson noise, cosmic variance, and photometric redshift errors. The data points are fitted by a single Schechter function, shown by a red solid line, while the red shaded area is its 1σ uncertainty. Data points (with their error bars) from other works are also shown: violet squares are taken from Davidzon et al. (2017), in magenta triangles we plot the mass functions by Ilbert et al. (2013), and in orange circles the one by Muzzin et al. (2013). The blue lines shows the H15 model for quiescent galaxies at z = 2.68 (left) and z = 3.44 (right).
Current usage metrics show cumulative count of Article Views (full-text article views including HTML views, PDF and ePub downloads, according to the available data) and Abstracts Views on Vision4Press platform.
Data correspond to usage on the plateform after 2015. The current usage metrics is available 48-96 hours after online publication and is updated daily on week days.
Initial download of the metrics may take a while.