Fig. 6.
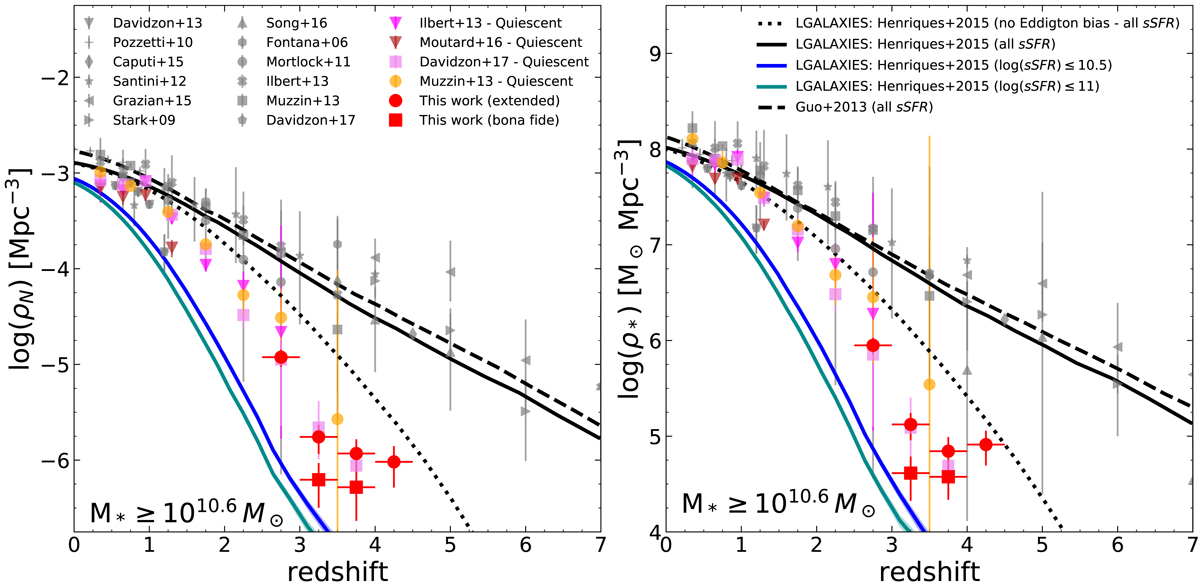
Number and stellar mass densities of galaxies with M ≥ 1010.6 M⊙ as function of redshift for total population of galaxies (in gray) or quiescent galaxies (colored points) in literature, compared to those obtained in this work. Our results are shown as red diamonds and squares for the BC03 extended and bona fide samples, respectively, with error bars representing the Poissonian errors, cosmic variance, and photometric redshift errors added in quadrature. The forecasts of two semi-analytic models are also shown: the black dashed and continuous lines represent the Guo et al. (2013) and the H15 models, respectively, estimated for the entire population of galaxies and convolved for the Eddington bias. The black dotted line represents the H15 model for the entire population not convolved for the Eddington bias. Blue and cyan shaded regions represent the H15 model with Poissonian error for the selected quiescent populations characterized by log(sSFR [yr−1])≤ − 10.5 and ≤ − 11, respectively.
Current usage metrics show cumulative count of Article Views (full-text article views including HTML views, PDF and ePub downloads, according to the available data) and Abstracts Views on Vision4Press platform.
Data correspond to usage on the plateform after 2015. The current usage metrics is available 48-96 hours after online publication and is updated daily on week days.
Initial download of the metrics may take a while.