Fig. 5.
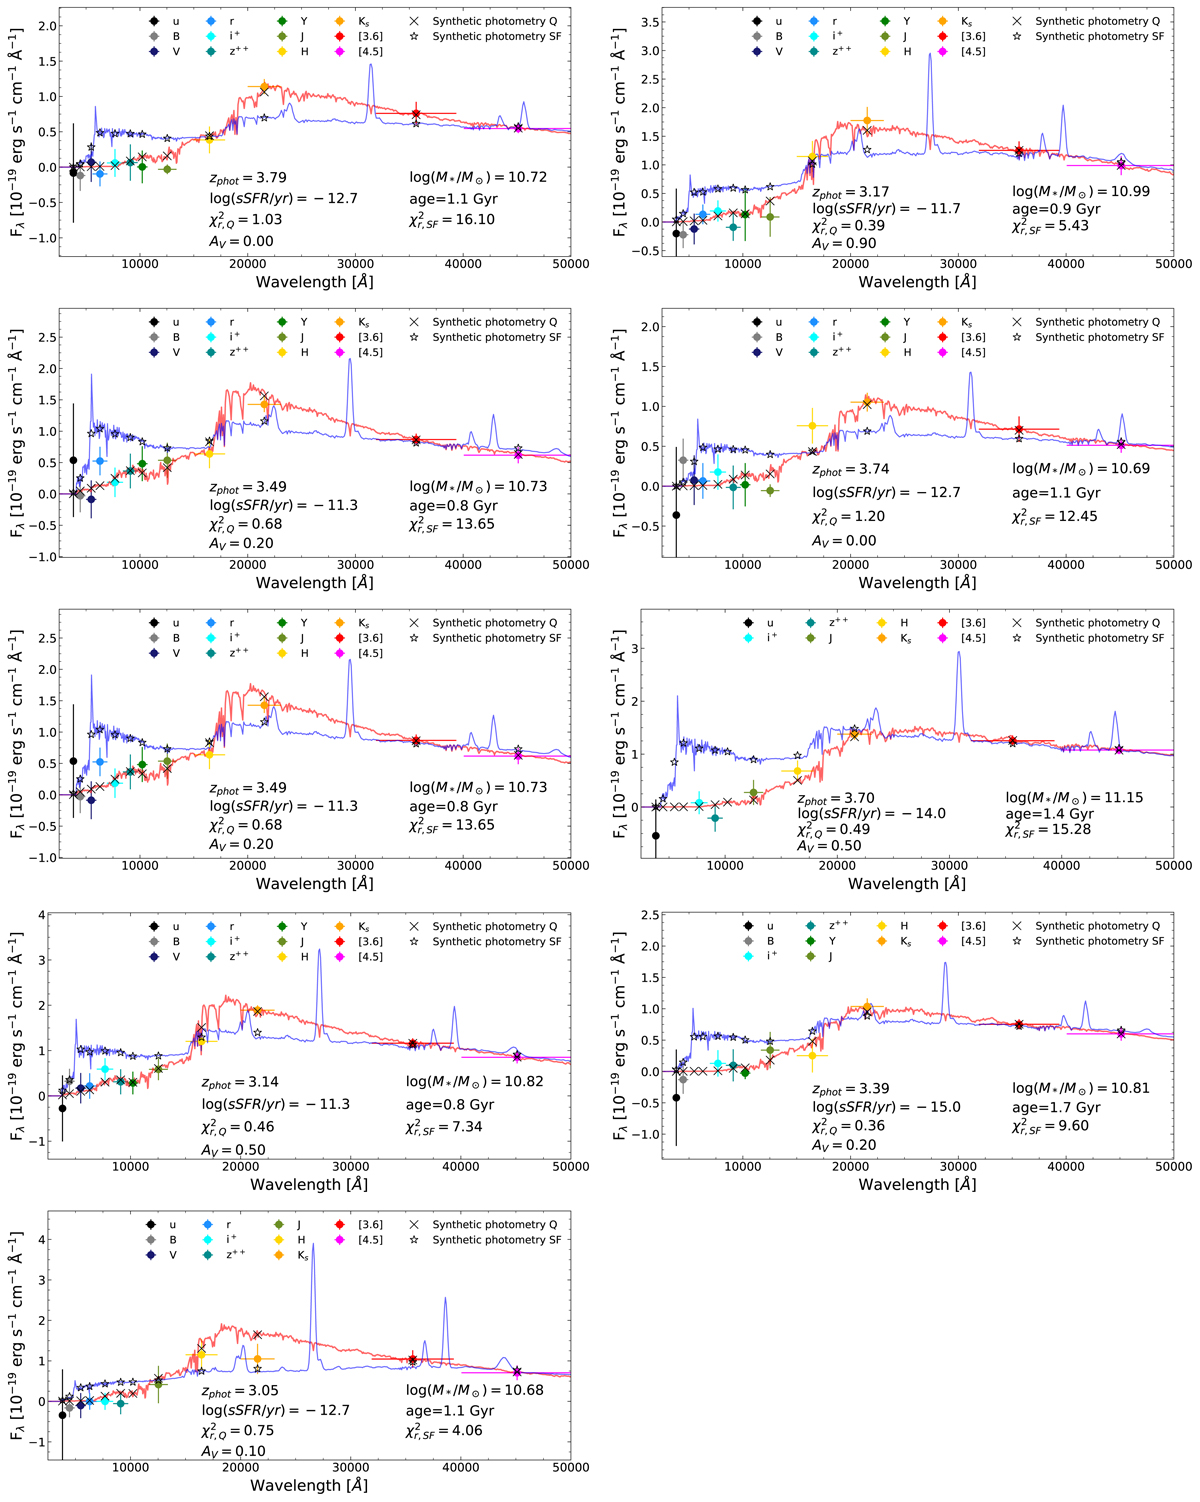
Best-fit models for all bona fide objects: colored points represent photometric points with error-bars, red lines are best-fit SEDs. The best fit using the star-forming template is shown with a blue line. Error bars in the wavelength scale refer to the width of the considered filter. Physical parameters evaluated through the SED fitting are shown in inserted labels. Black tilted crosses and stars show the synthetic photometry, evaluated by integrating the best-fit templates in the several bands, for the best-fit quiescent and star-forming templates respectively. All filters used in the fit are listed in inserted legends for each plot.
Current usage metrics show cumulative count of Article Views (full-text article views including HTML views, PDF and ePub downloads, according to the available data) and Abstracts Views on Vision4Press platform.
Data correspond to usage on the plateform after 2015. The current usage metrics is available 48-96 hours after online publication and is updated daily on week days.
Initial download of the metrics may take a while.