Fig. 3.
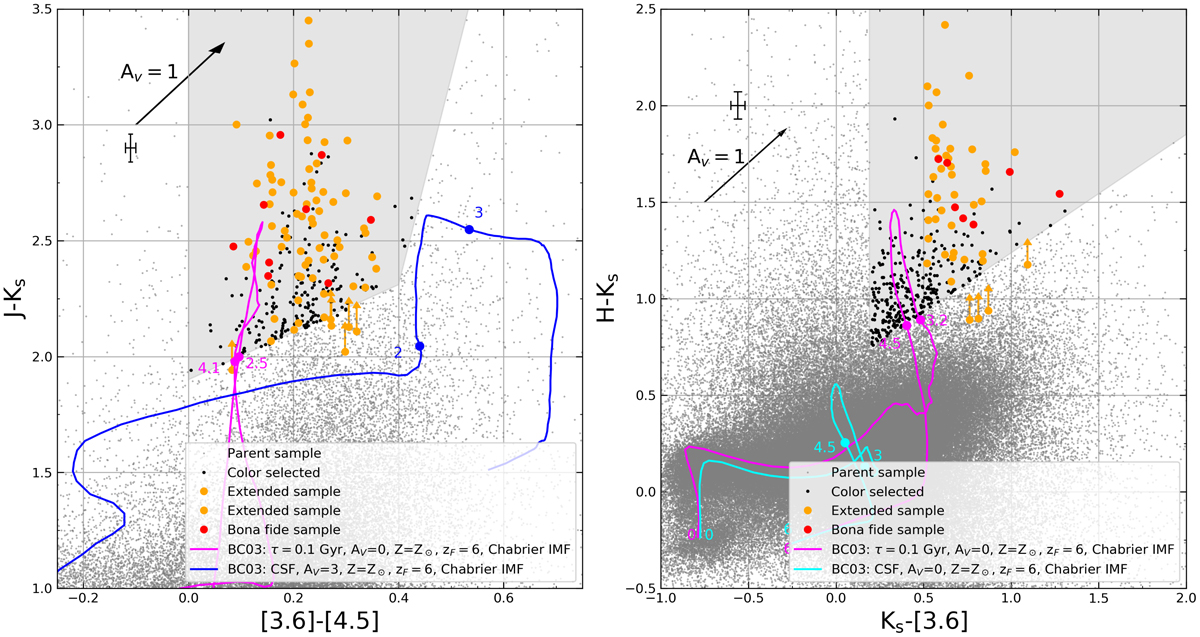
Observed color–color diagrams. Left: JKs[3.6][4.5]. Right: HKs[3.6]. Gray shaded areas represent the color selection regions defined in Sect. 2 and the evolution of the colors of a quiescent and a star-forming galaxies are plotted as a reference. Gray points represent the whole parent sample selected as in Sect. 3.2, black points show the color-selected-only quiescent candidate. Red points are “bona fide” objects, while orange points belong to the “extended” sample, both defined in Sect. 4. The mean photometric errors of the color-selected candidates (black points) are also shown. Objects that are non-detected in one or more filters in the color-selected sample are not shown in order to improve clarity given their large number. Only undetected objects belonging to extended or bona fide samples are shown with arrows indicating the lower limits of the involved color. Non-detections correspond to < 2σ.
Current usage metrics show cumulative count of Article Views (full-text article views including HTML views, PDF and ePub downloads, according to the available data) and Abstracts Views on Vision4Press platform.
Data correspond to usage on the plateform after 2015. The current usage metrics is available 48-96 hours after online publication and is updated daily on week days.
Initial download of the metrics may take a while.