Fig. A.5.
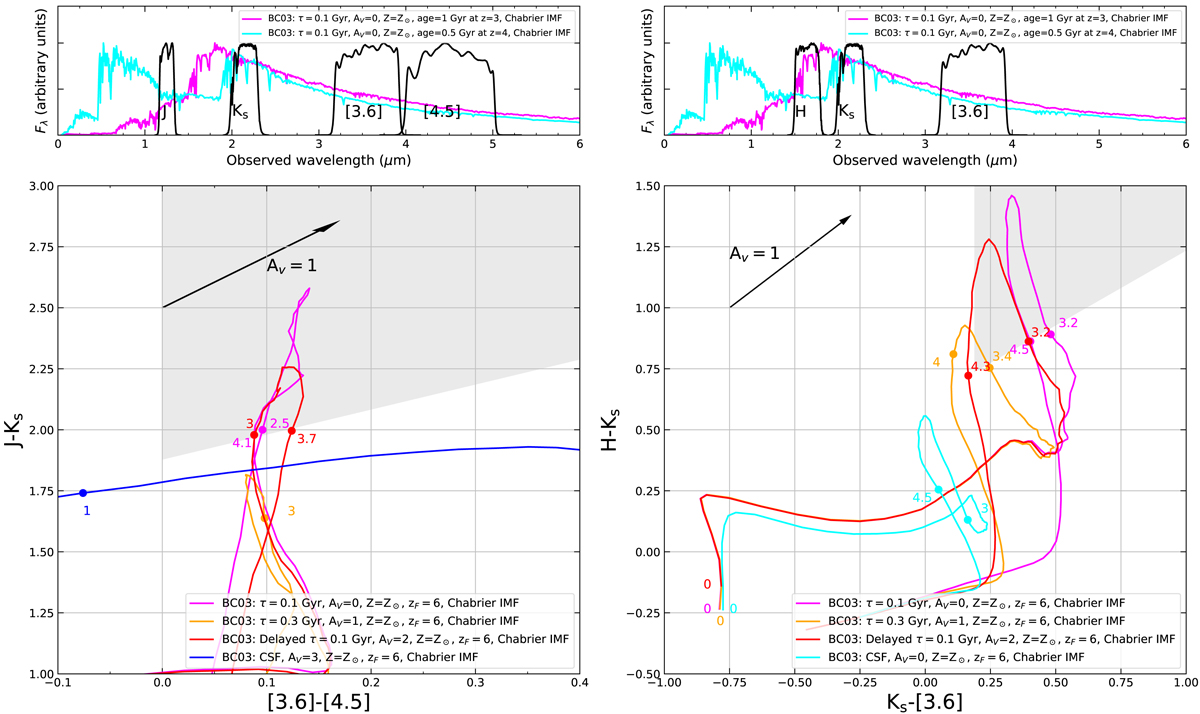
Effect of SFHs on JKs[3.6][4.5] and HKs[3.6] color–color diagrams. Top panels: two SEDs of quiescent galaxies are shown in magenta SED and cyan, representing a population of 1 Gyr redshifted to z = 3 (i.e. zform ≈ 6), and a population of 0.5 Gyr redshifted to z = 4 (i.e., again zform ≈ 6), respectively. Bottom: color–color plots with evolutionary tracks for star-forming and passive galaxies. Tracks representing star-forming galaxies are shown in blue and cyan and their characteristics are shown in the inserted legends. Three tracks for quiescent galaxies are shown in magenta, orange and red: the magenta track is parametrized with an exponentially declining star formation with τ = 0.1 Gyr, orange track has τ = 0.3 Gyr, and red track has been parametrized with a delayed star formation history where τ = 0.1 Gyr.
Current usage metrics show cumulative count of Article Views (full-text article views including HTML views, PDF and ePub downloads, according to the available data) and Abstracts Views on Vision4Press platform.
Data correspond to usage on the plateform after 2015. The current usage metrics is available 48-96 hours after online publication and is updated daily on week days.
Initial download of the metrics may take a while.