Fig. 1.
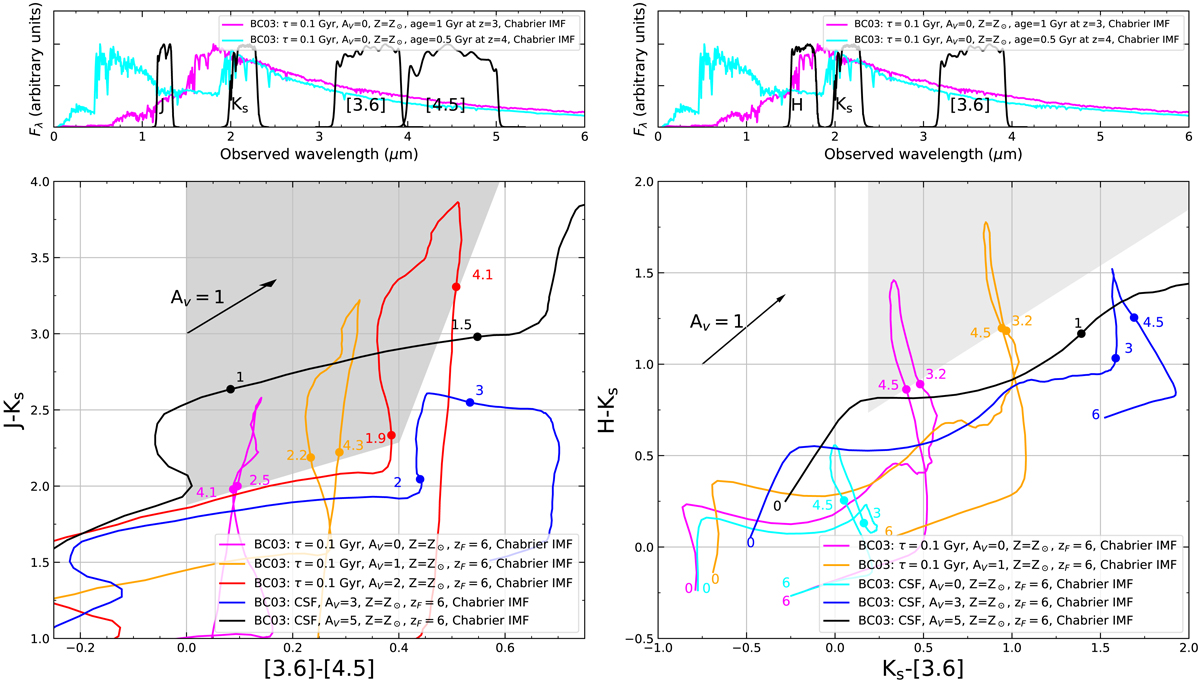
Top panels: two SEDs of quiescent galaxies. SED in magenta represents a population of 1 Gyr redshifted to z = 3 (i.e., zform ≈ 6), while the cyan line shows the SED of a population of 0.5 Gyr redshifted to z = 4 (i.e., again zform ≈ 6). Filters transmission curves used in COSMOS field and in the tracks evaluations are also shown. Bottom panels: JKs[3.6][4.5] and HKs[3.6] color–color diagrams with different evolutionary tracks both for star-forming galaxies and passive galaxies. Tracks representing star-forming galaxies are shown in cyan, blue and black with AV = 0, AV = 3, and AV = 5 respectively. Three tracks for quiescent galaxies (with exponentially declining star formation history τ = 0.1 Gyr and solar metallicity) are shown in magenta, orange and red with different extinction values (AV = 0, AV = 1, and AV = 2 respectively). Gray shaded areas represent the selection region for quiescent galaxies at 2.5 ≲ z ≲ 4 in the left panel and at 3 ≲ z ≲ 4.5 in the right panel. The numbers near the tracks of the same color represent the redshift. A vector corresponding to a magnitude extinction of AV = 1 using Calzetti’s law is also shown.
Current usage metrics show cumulative count of Article Views (full-text article views including HTML views, PDF and ePub downloads, according to the available data) and Abstracts Views on Vision4Press platform.
Data correspond to usage on the plateform after 2015. The current usage metrics is available 48-96 hours after online publication and is updated daily on week days.
Initial download of the metrics may take a while.