Fig. 9.
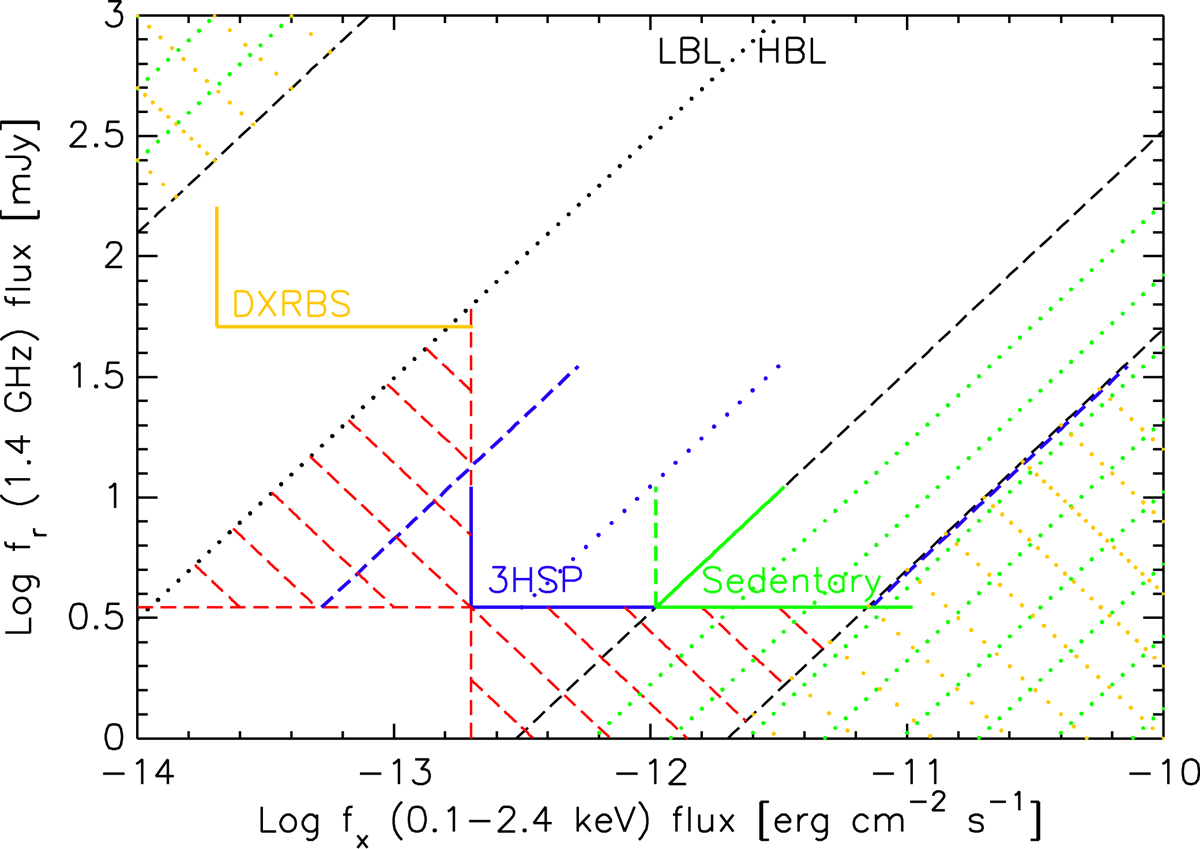
Sampling of the radio flux density–X-ray flux plane with the 3HSP, Sedentary, and DXRBS samples. The blue dashed and dotted lines are the slope limits for the 3HSP sample. The black dotted line is the flux ratio that separates LBL and HBL. The green and yellow dotted lines denote the forbidden region for BL Lacs and FSRQs. The red dashed lines indicate the incomplete regions of 2WHSP.
Current usage metrics show cumulative count of Article Views (full-text article views including HTML views, PDF and ePub downloads, according to the available data) and Abstracts Views on Vision4Press platform.
Data correspond to usage on the plateform after 2015. The current usage metrics is available 48-96 hours after online publication and is updated daily on week days.
Initial download of the metrics may take a while.