Free Access
Fig. 6.
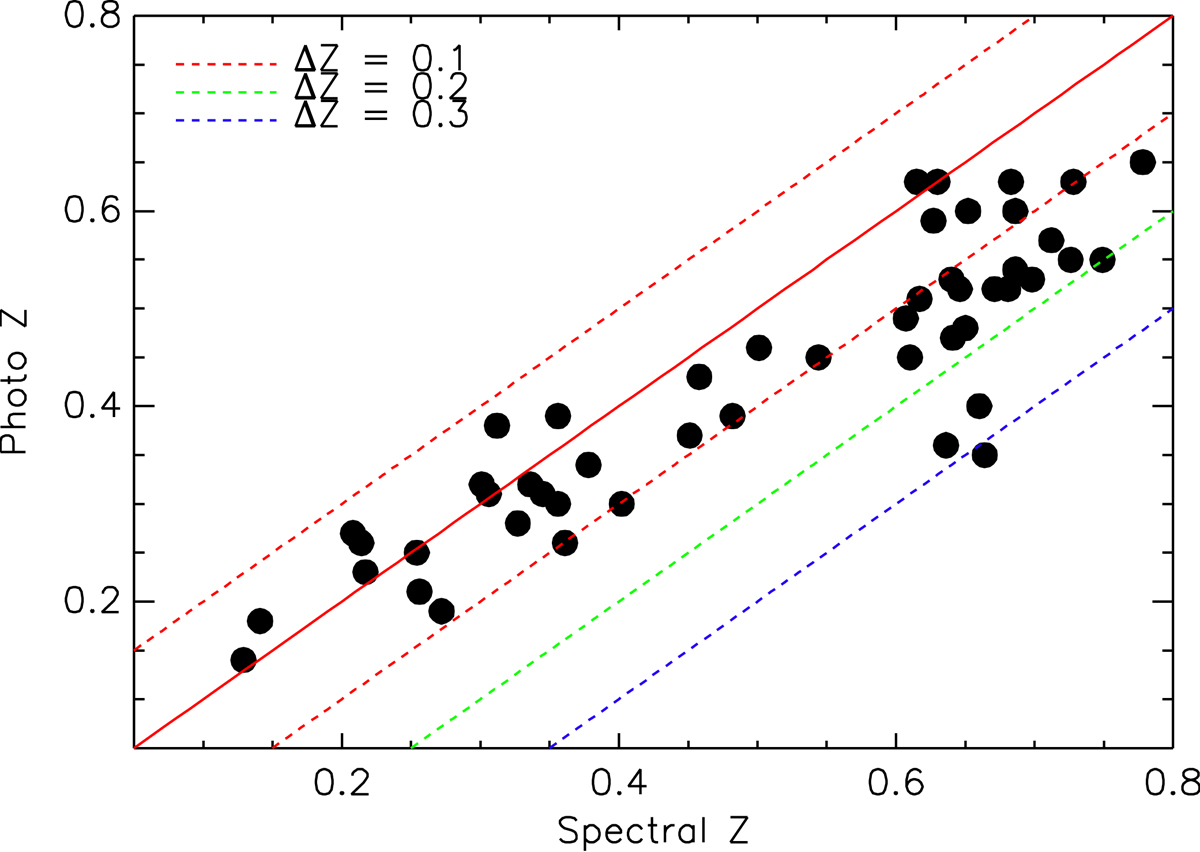
Comparison between photo-z and spectral-z. The central solid line has slope of one and represents the equality between the two redshift estimations, while the red, green, and blue dashed lines indicate a scatter of 0.1, 0.2, 0.3, respectively.
Current usage metrics show cumulative count of Article Views (full-text article views including HTML views, PDF and ePub downloads, according to the available data) and Abstracts Views on Vision4Press platform.
Data correspond to usage on the plateform after 2015. The current usage metrics is available 48-96 hours after online publication and is updated daily on week days.
Initial download of the metrics may take a while.