Fig. 5.
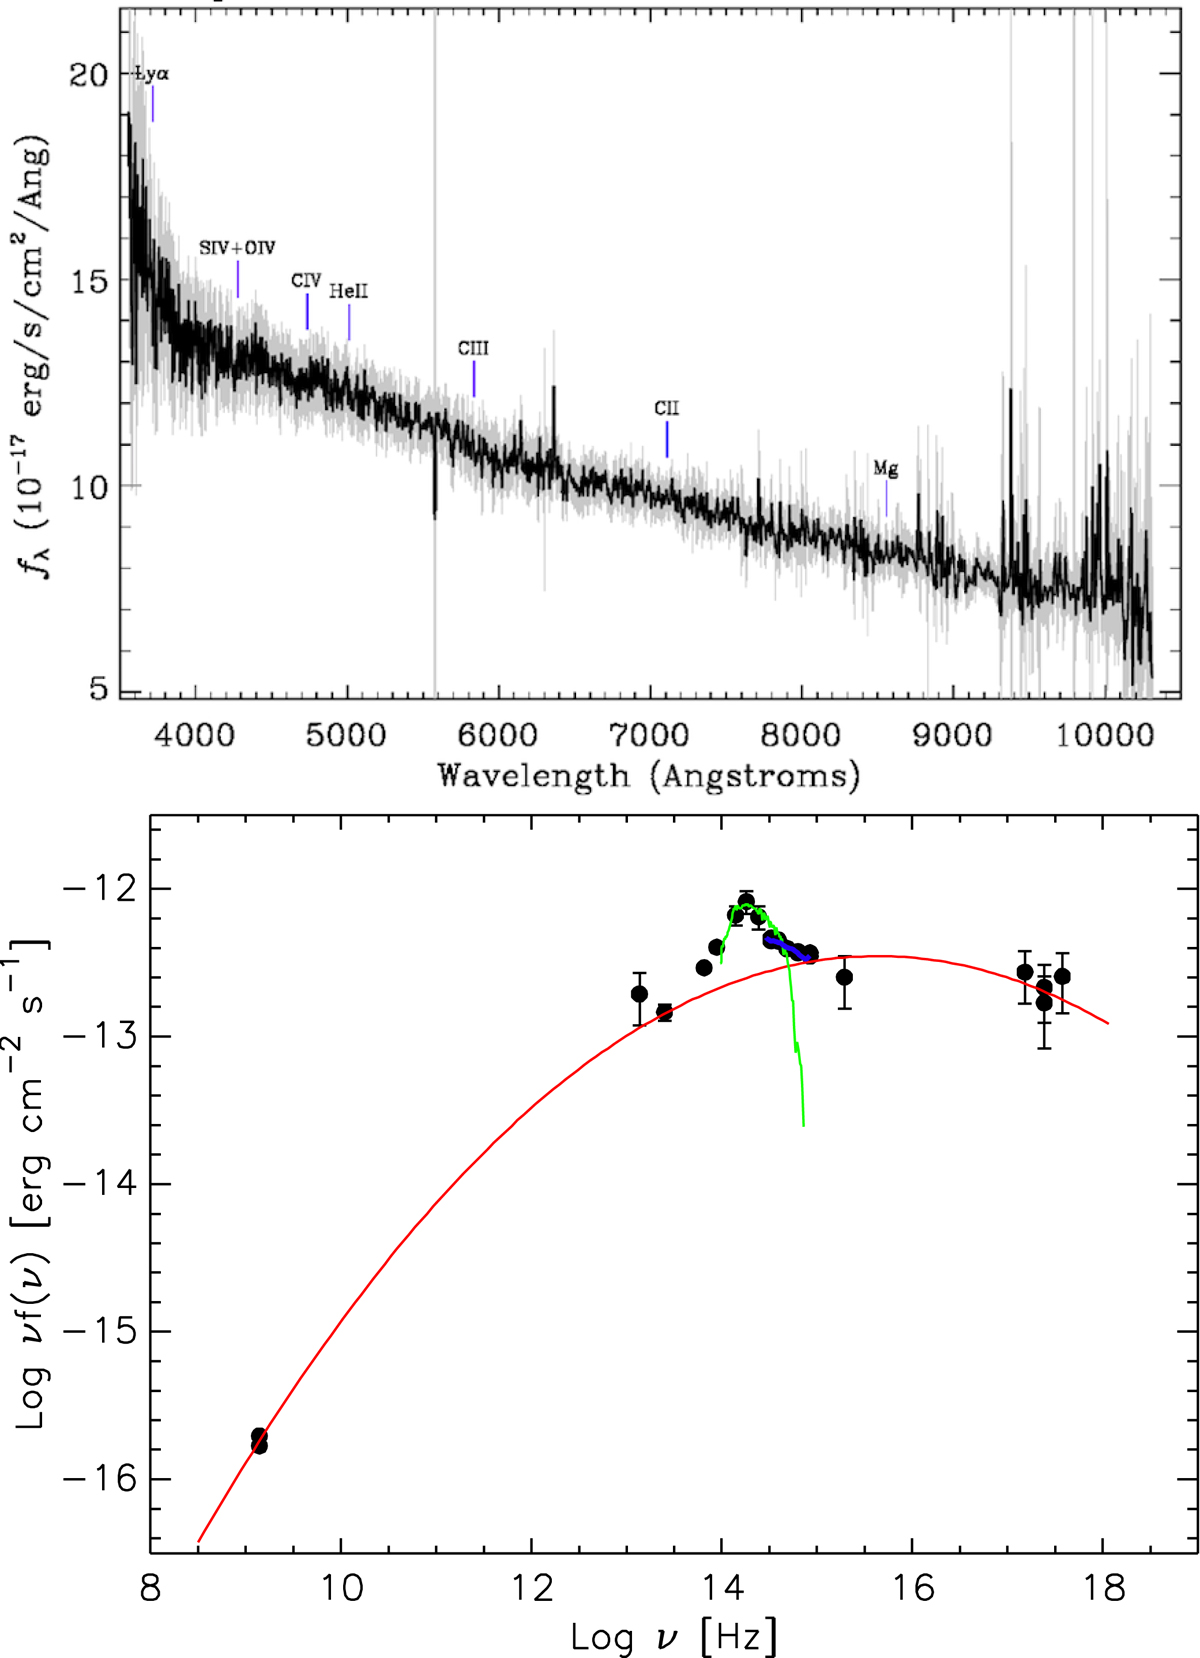
Example of photometric redshift (photo-z) estimation. The SDSS Dr14 optical spectrum (top) and SED (bottom) of the source 3HSP J154433.1+322148. The red line represents the non-thermal component, the green line the giant elliptical template fitted to the IR (and partly optical) data at z = 0.32, and the blue line the data extract from the SDSS DR14 optical spectrum.
Current usage metrics show cumulative count of Article Views (full-text article views including HTML views, PDF and ePub downloads, according to the available data) and Abstracts Views on Vision4Press platform.
Data correspond to usage on the plateform after 2015. The current usage metrics is available 48-96 hours after online publication and is updated daily on week days.
Initial download of the metrics may take a while.