Free Access
Fig. 10.
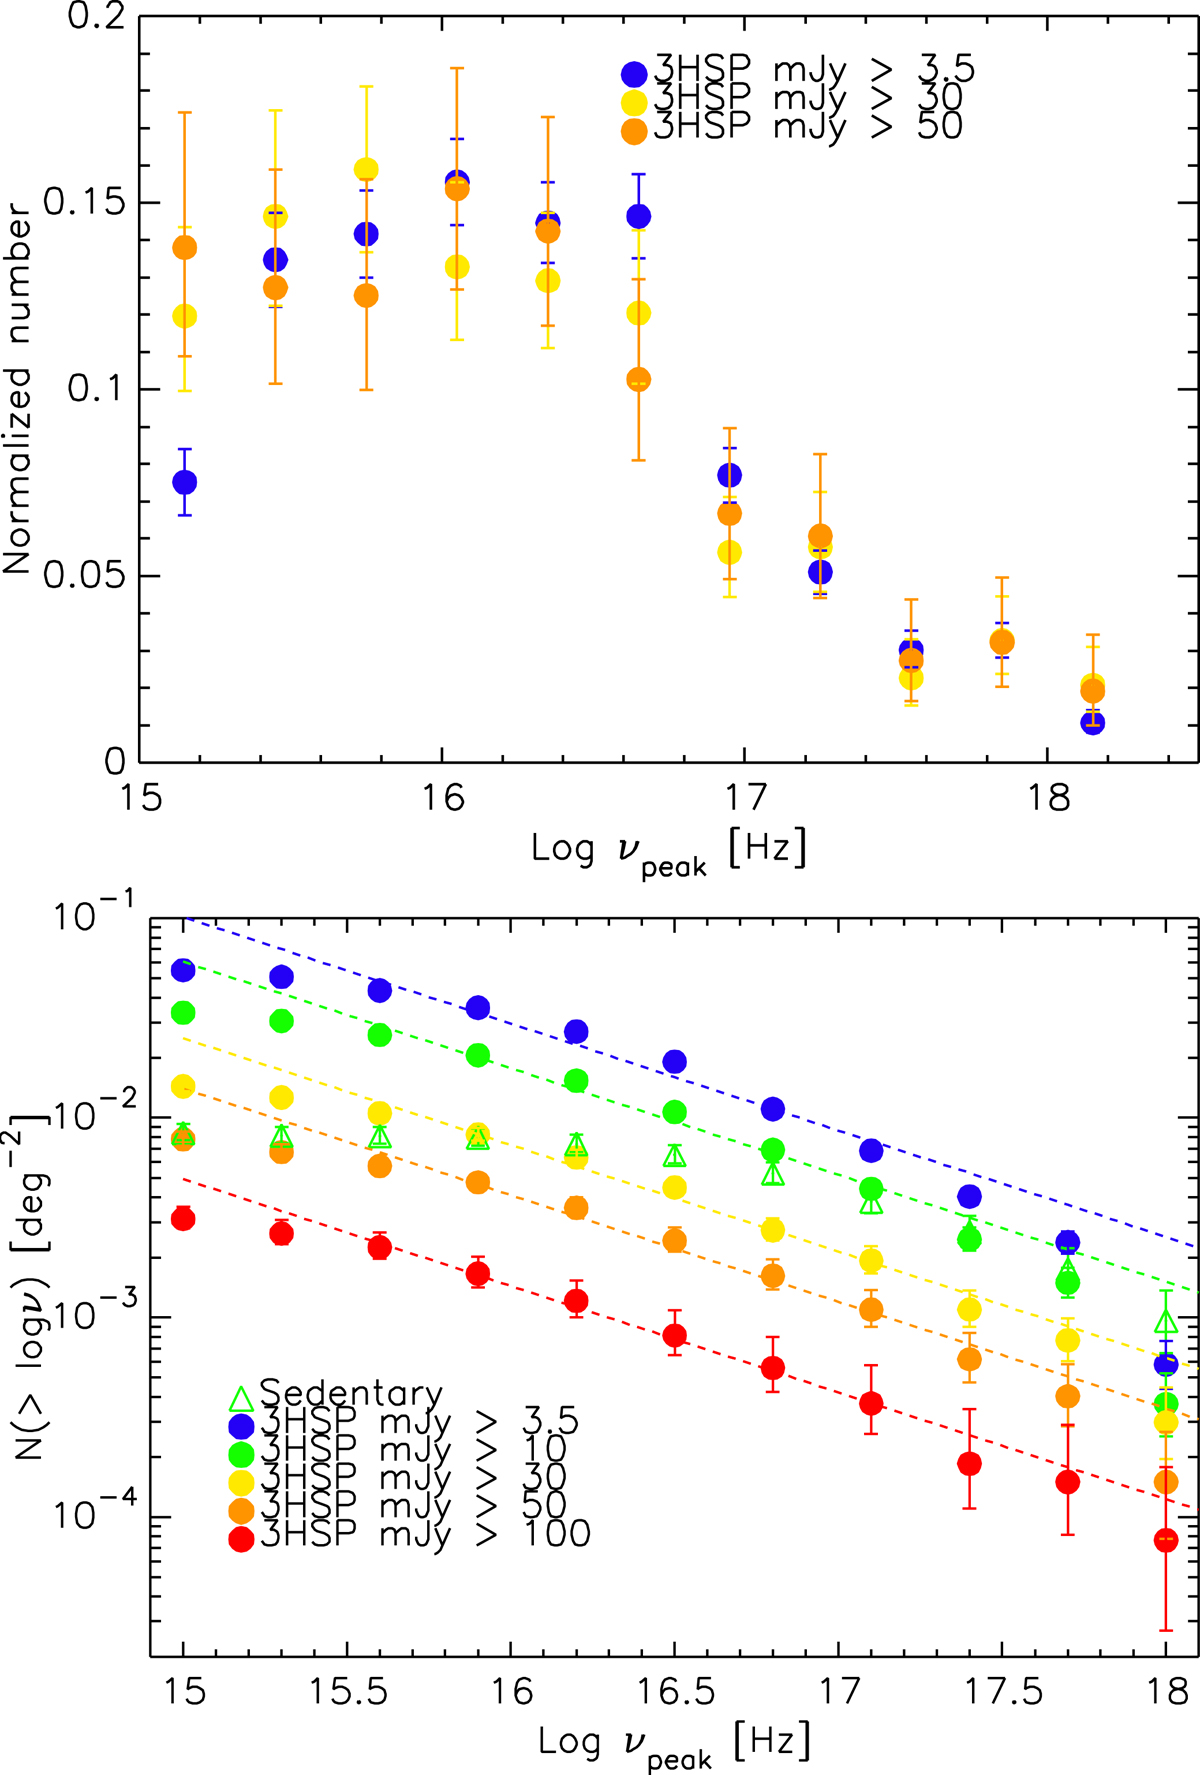
Differential (top) and cumulative (bottom) synchrotron νpeak distribution for the 3HSP-NVSS-RASS sample with different radio flux density cuts. Different colours indicate different radio flux cuts. The dashed lines represent the best fixed-slope linear fitting for each radio-cut subsample.
Current usage metrics show cumulative count of Article Views (full-text article views including HTML views, PDF and ePub downloads, according to the available data) and Abstracts Views on Vision4Press platform.
Data correspond to usage on the plateform after 2015. The current usage metrics is available 48-96 hours after online publication and is updated daily on week days.
Initial download of the metrics may take a while.