Fig. 2
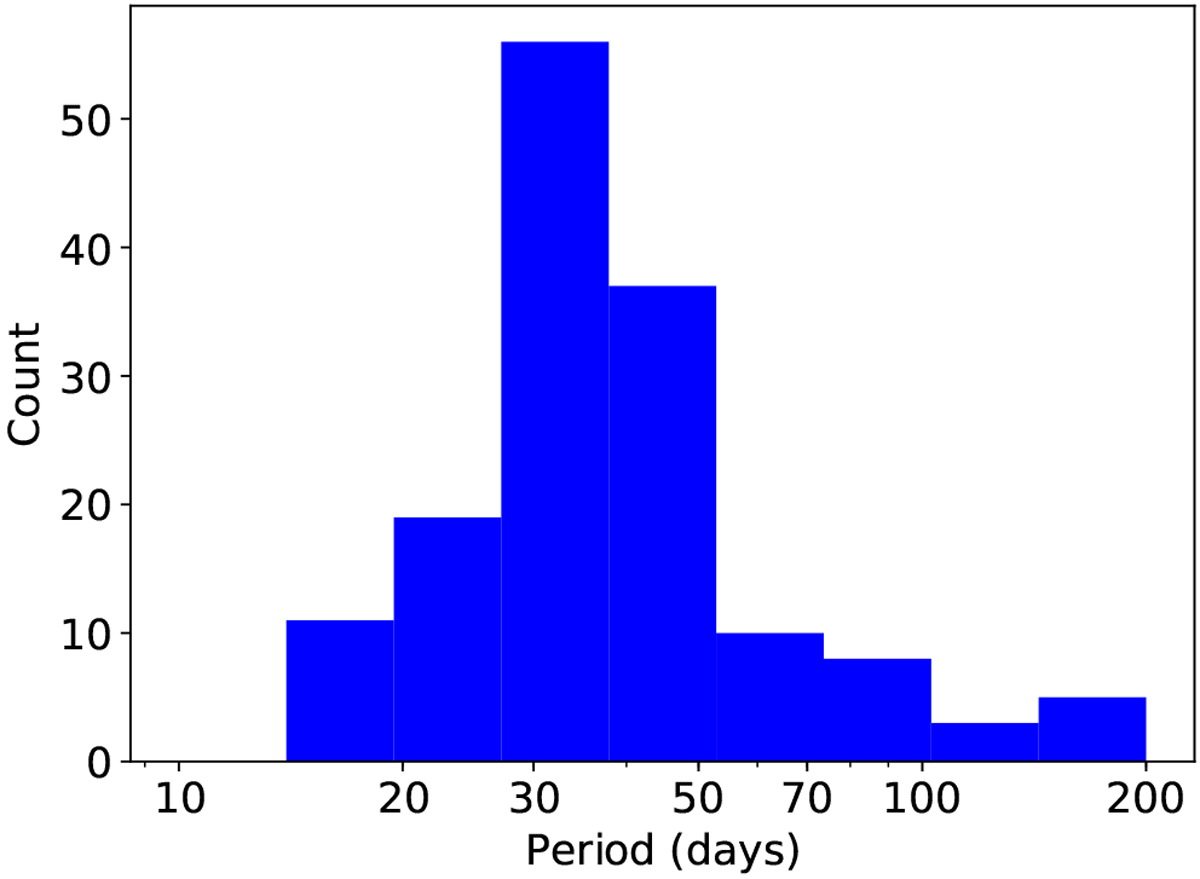
Period distribution of systems that remain as monotransits once the Year 1 and Year 4 data have been obtained. Approximately half of these systems are found in the Year 1 data, and half are in the Year 4 data. Note there are far fewer than the original monotransit yield from the Year 1 alone, and the distribution is shifted towards longer period systems.
Current usage metrics show cumulative count of Article Views (full-text article views including HTML views, PDF and ePub downloads, according to the available data) and Abstracts Views on Vision4Press platform.
Data correspond to usage on the plateform after 2015. The current usage metrics is available 48-96 hours after online publication and is updated daily on week days.
Initial download of the metrics may take a while.