Fig. 3.
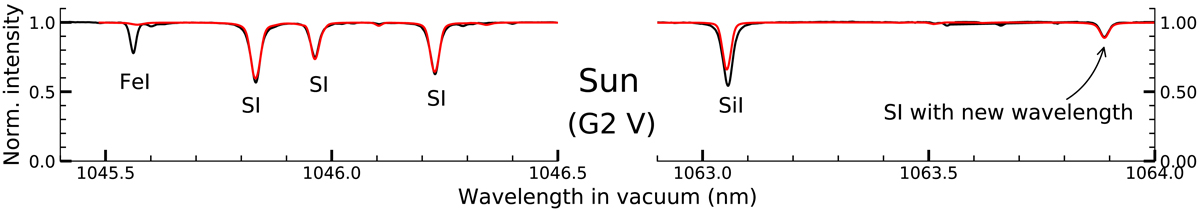
Intensity spectrum of the solar centre around the S I triplet at 1045 nm and the moved S I line. No further adjustments to the line strengths in the line lists from VALD have been made. Solar abundances (Grevesse et al. 2007) are assumed, and the log gf values of the S I lines are those that are listed in NIST, i.e. Zerne et al. (1997) and Zatsarinny & Bartschat (2006). The Fe I and Si I lines obviously have incorrect log gf values and can be adjusted to solar astrophysical values if required.
Current usage metrics show cumulative count of Article Views (full-text article views including HTML views, PDF and ePub downloads, according to the available data) and Abstracts Views on Vision4Press platform.
Data correspond to usage on the plateform after 2015. The current usage metrics is available 48-96 hours after online publication and is updated daily on week days.
Initial download of the metrics may take a while.