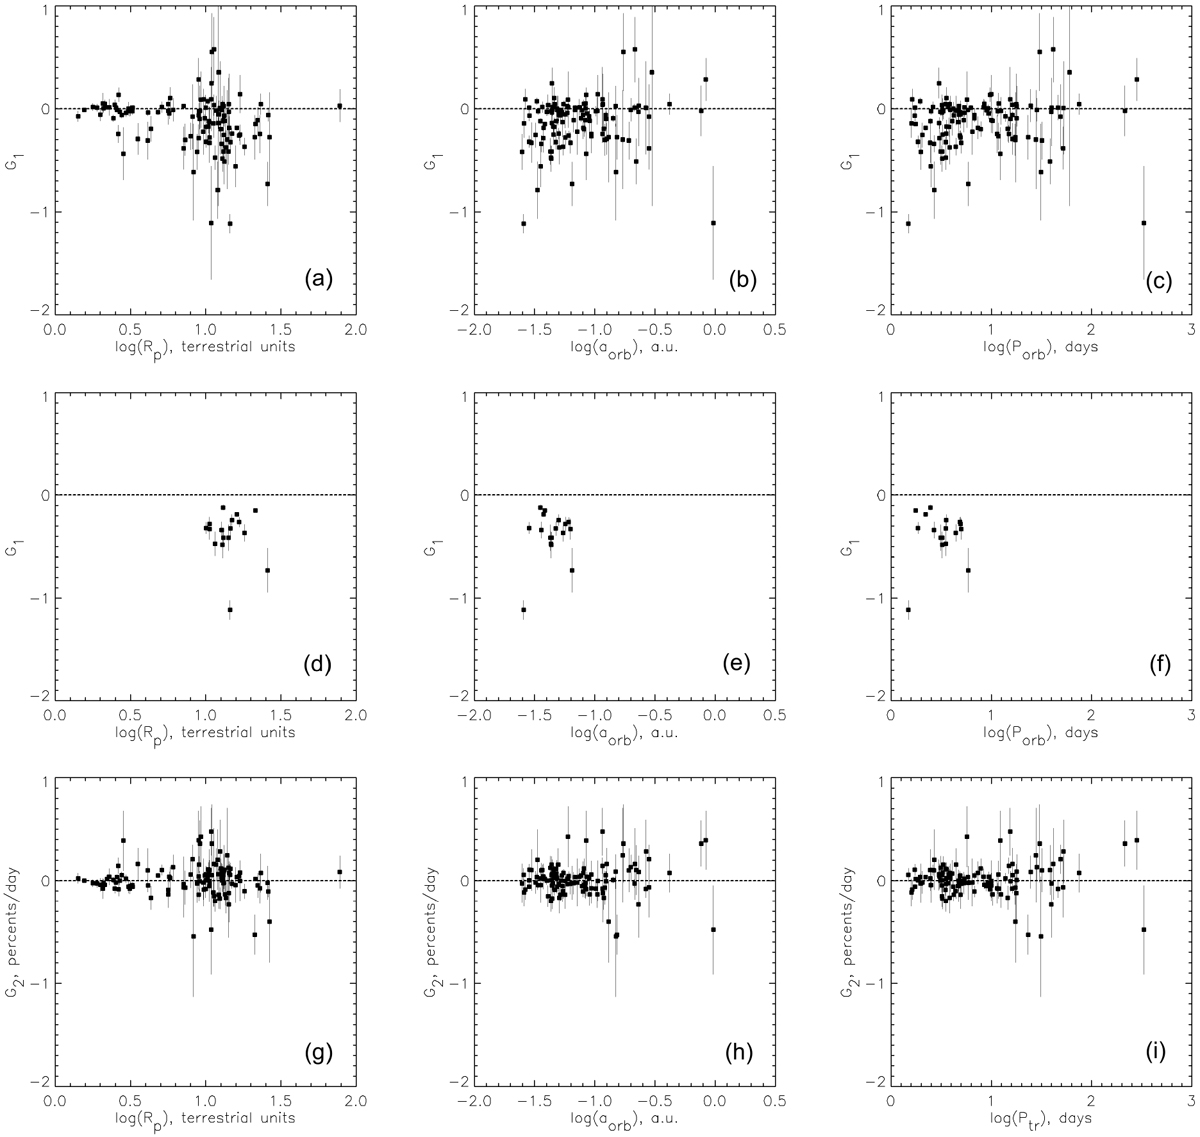
Fig. 5

Gradients G1 and G2, measured in the adjoining regions, versus planetary parameters: radius Rp of planet in (a), (d), and (g); radius aorb of orbit in (b), (e), and (h); and the orbital period Ptr in (c),(f), and (i). The plots (a)–(c) and (g)–(i) show all the studied objects (squares with error bars) from Table C.1, while the middle row panels (d)–(f) present only significant (above three standard errors) deviations of |G1 | from zero (listed in Table 1).
Current usage metrics show cumulative count of Article Views (full-text article views including HTML views, PDF and ePub downloads, according to the available data) and Abstracts Views on Vision4Press platform.
Data correspond to usage on the plateform after 2015. The current usage metrics is available 48-96 hours after online publication and is updated daily on week days.
Initial download of the metrics may take a while.


