Fig. 2
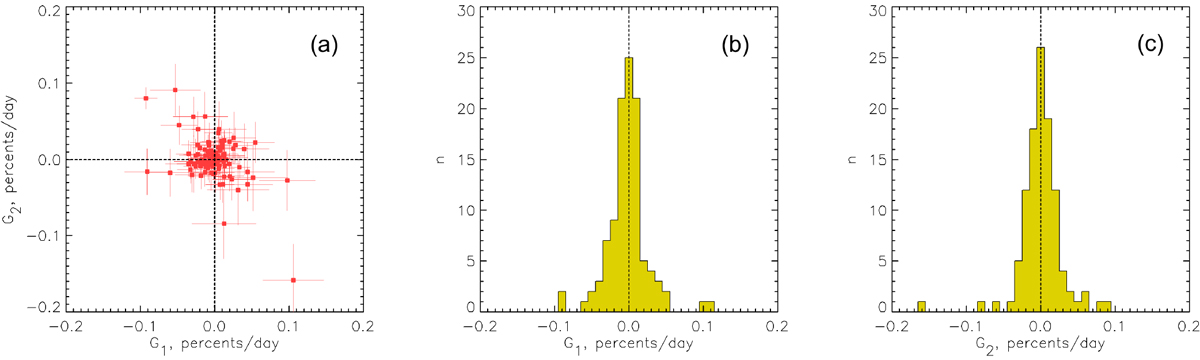
Distributions of the pre-ingress, G1, and post-egress, G2, gradientestimates of TLC for the distant pre- and post-transit regions with τmin = 0.03 days and τmax = 0.16 days for 114 KOIs with errors < 0.05%∕day: panel a: G2 vs. G1 diagram; panel b: histogram of G1; panel c: histogram of G2. The value n is the number of estimates within a bin of histogram.
Current usage metrics show cumulative count of Article Views (full-text article views including HTML views, PDF and ePub downloads, according to the available data) and Abstracts Views on Vision4Press platform.
Data correspond to usage on the plateform after 2015. The current usage metrics is available 48-96 hours after online publication and is updated daily on week days.
Initial download of the metrics may take a while.