Fig. 9.
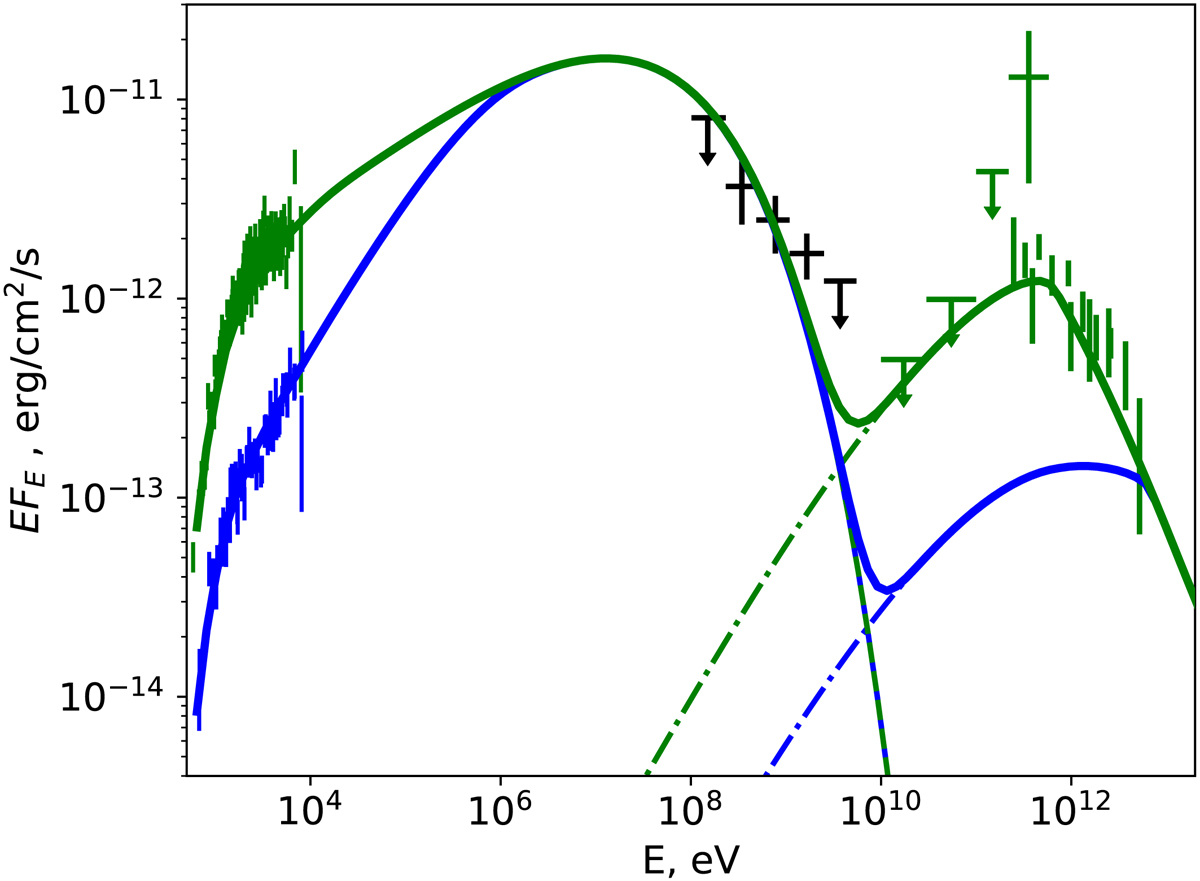
X-ray-to-TeV spectrum of HESS J0632+057 during its high state (green points; orbital phases ϕ ≈ 0.3 − 0.4) and low state (blue points; ϕ ≈ 0.4 − 0.5). The data are adopted from Malyshev et al. (2017) (X-rays), Li et al. (2017) (mean GeV spectrum, black points), and Malyshev & Chernyakova (2016) (green upper limits). TeV data are adopted from Maier & VERITAS Collaboration (2015). The solid lines show the “similar to PSR B1259−63” model flux, while dashed and dot-dashed lines illustrate contributions from synchrotron and IC model components correspondingly. See text for more details.
Current usage metrics show cumulative count of Article Views (full-text article views including HTML views, PDF and ePub downloads, according to the available data) and Abstracts Views on Vision4Press platform.
Data correspond to usage on the plateform after 2015. The current usage metrics is available 48-96 hours after online publication and is updated daily on week days.
Initial download of the metrics may take a while.