Fig. 8.
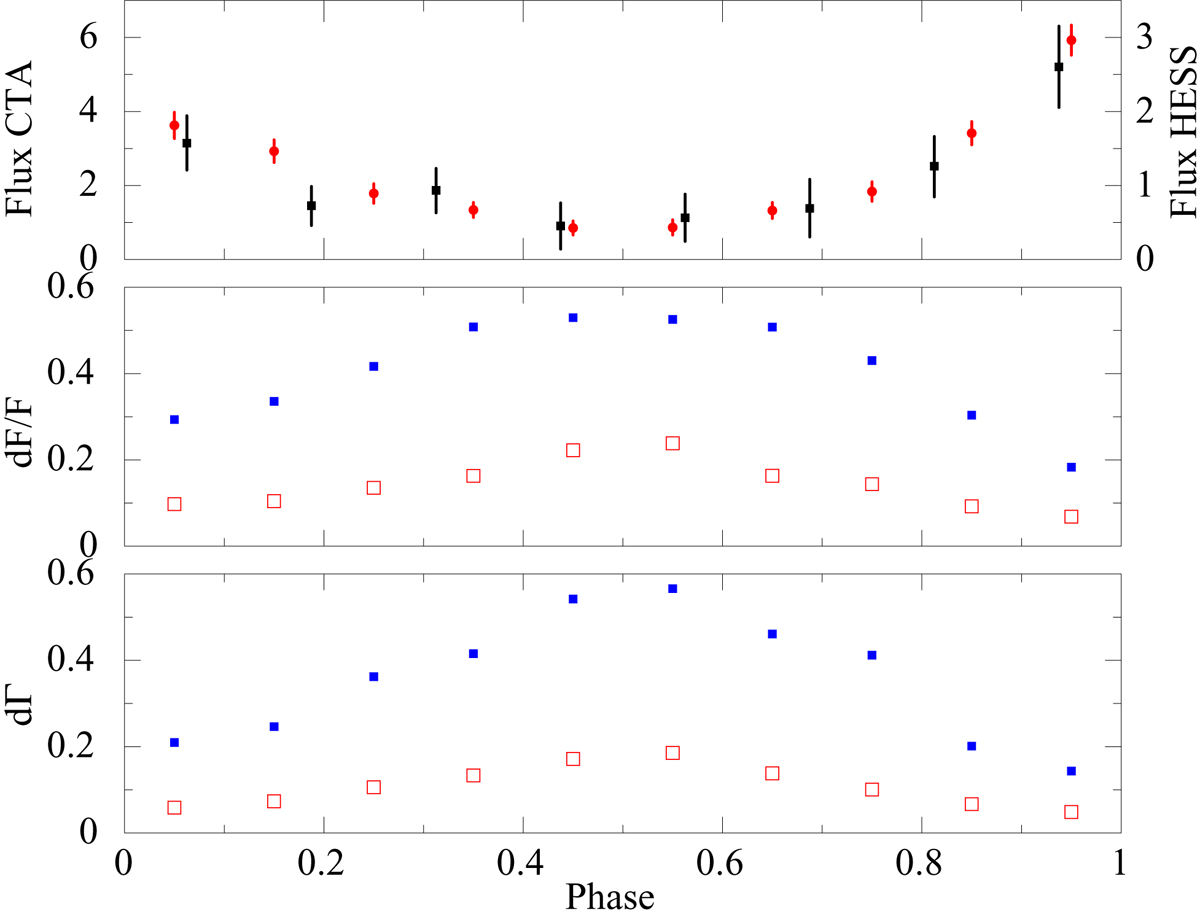
Simulated CTA view of 1FGL J1018.6−5856 orbital variability. Upper panel: flux modulation of 1FGL J1018.6−5856 throughout the orbital phase as observed with H.E.S.S. (black symbols, in units of 10−12 ph cm−2 s−1 for E > 0.35 TeV) and simulated for 5 h of observation with the CTA (red symbols, in units of 10−13 ph cm−2 s−1 for E > 1 TeV). Middle panel: flux relative error in the case of simulated CTA observations of 30 min (blue filled squares) and 5 h (red open squares). Lower panel: uncertainty of the photon index Γ in the same cases.
Current usage metrics show cumulative count of Article Views (full-text article views including HTML views, PDF and ePub downloads, according to the available data) and Abstracts Views on Vision4Press platform.
Data correspond to usage on the plateform after 2015. The current usage metrics is available 48-96 hours after online publication and is updated daily on week days.
Initial download of the metrics may take a while.