Free Access
Fig. 7.
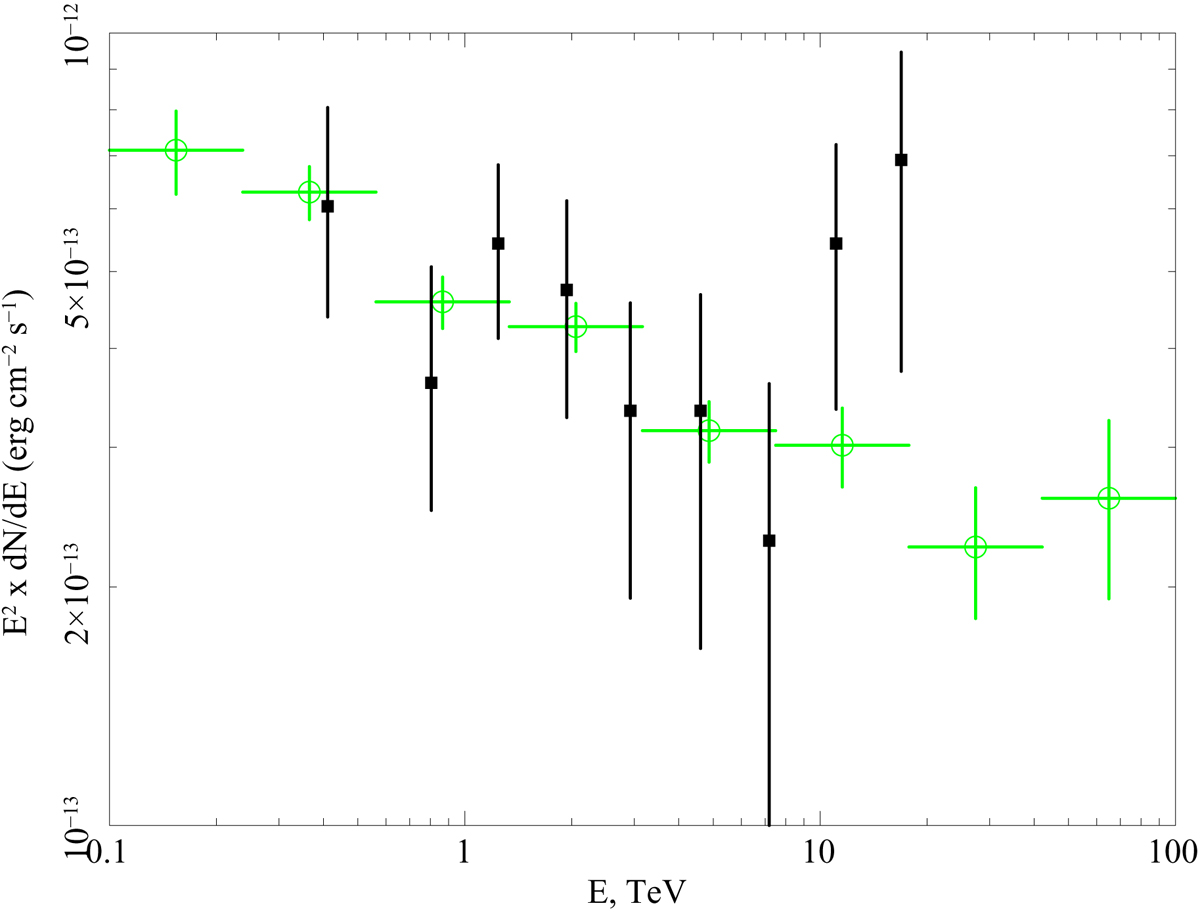
Real and simulated spectra of 1FGL J1018.6−5856. Black: spectrum of 1FGL J1018.6−5856 obtained with 63 h of observation with H.E.S.S. (H.E.S.S. Collaboration 2015a). Green: simulation of the source spectrum obtained with 50 h of observation with CTA.
Current usage metrics show cumulative count of Article Views (full-text article views including HTML views, PDF and ePub downloads, according to the available data) and Abstracts Views on Vision4Press platform.
Data correspond to usage on the plateform after 2015. The current usage metrics is available 48-96 hours after online publication and is updated daily on week days.
Initial download of the metrics may take a while.