Fig. 6.
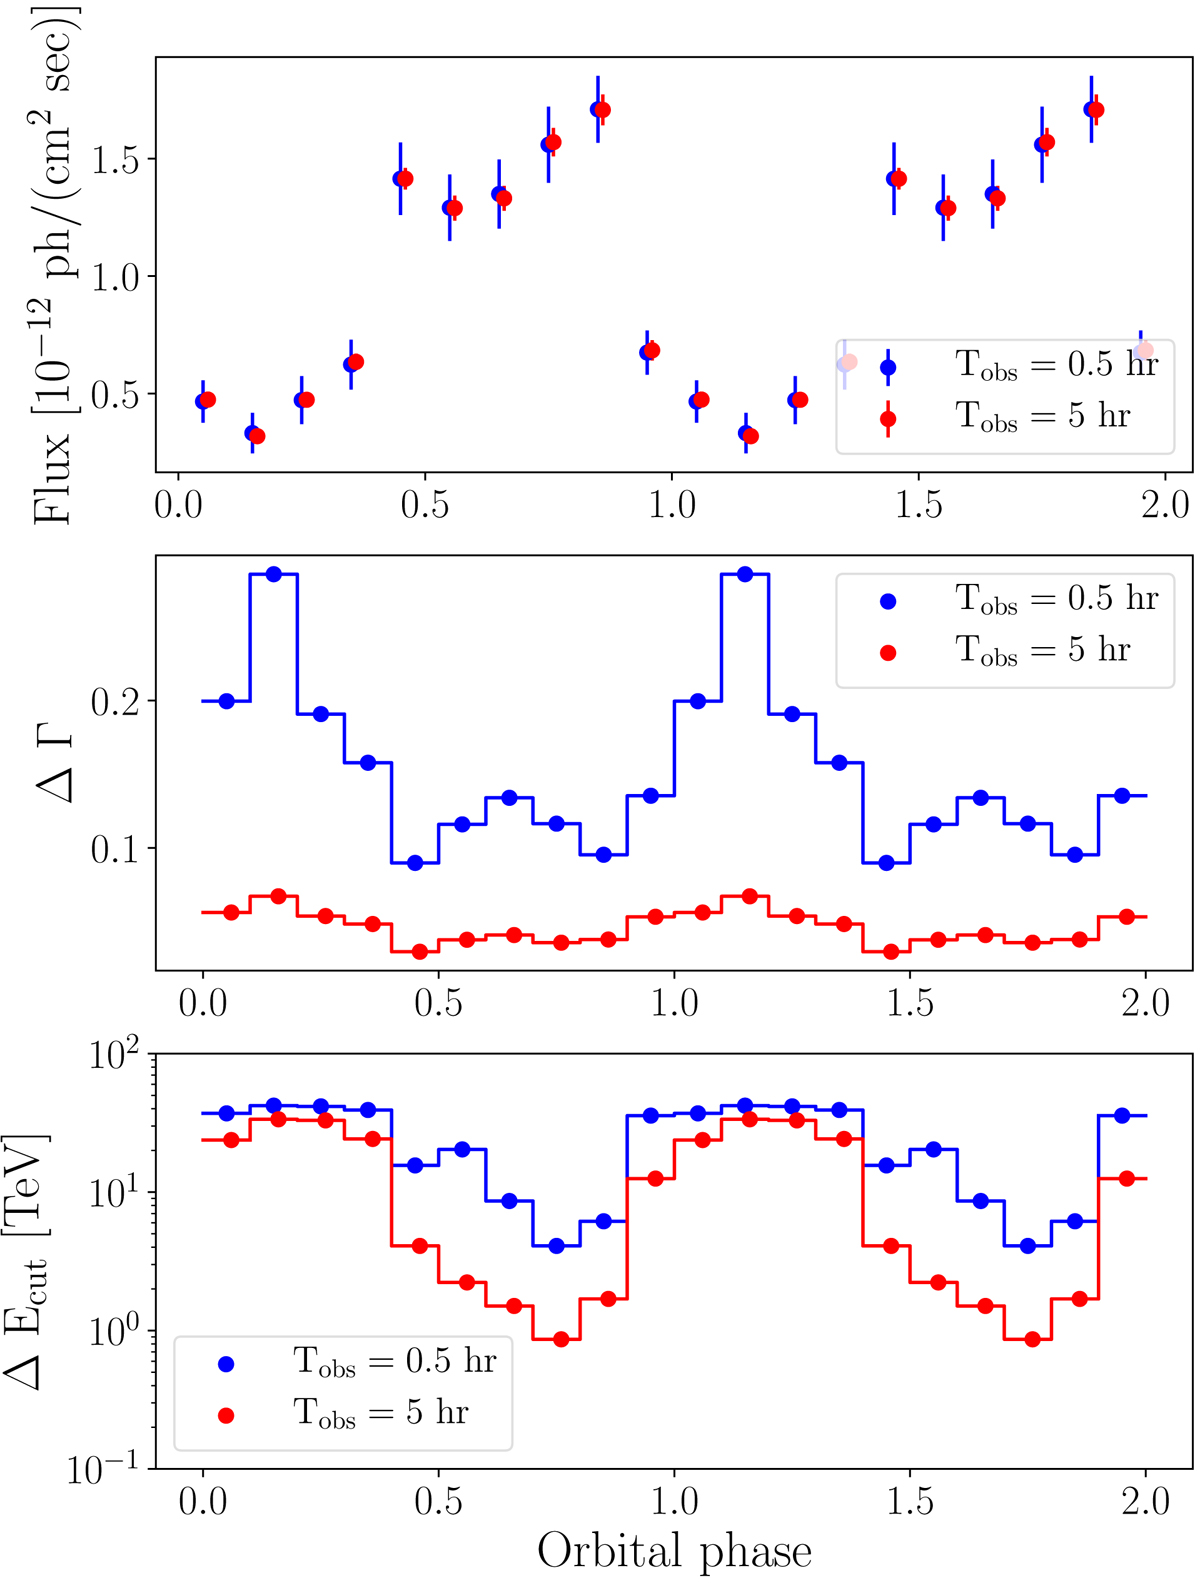
Simulated CTA view of LS 5039 orbital variations above 1 TeV energy for 0.5 and 5 h long snapshots as observed from the southern CTA site. Upper panel: integral flux above 1 TeV, and middle and lower panels: estimated uncertainty of the measured spectral index and cut-off energy, correspondingly. The data points corresponding to Tobs = 5 h are shifted to the right by 0.01 phase for clarity.
Current usage metrics show cumulative count of Article Views (full-text article views including HTML views, PDF and ePub downloads, according to the available data) and Abstracts Views on Vision4Press platform.
Data correspond to usage on the plateform after 2015. The current usage metrics is available 48-96 hours after online publication and is updated daily on week days.
Initial download of the metrics may take a while.