Fig. 5.
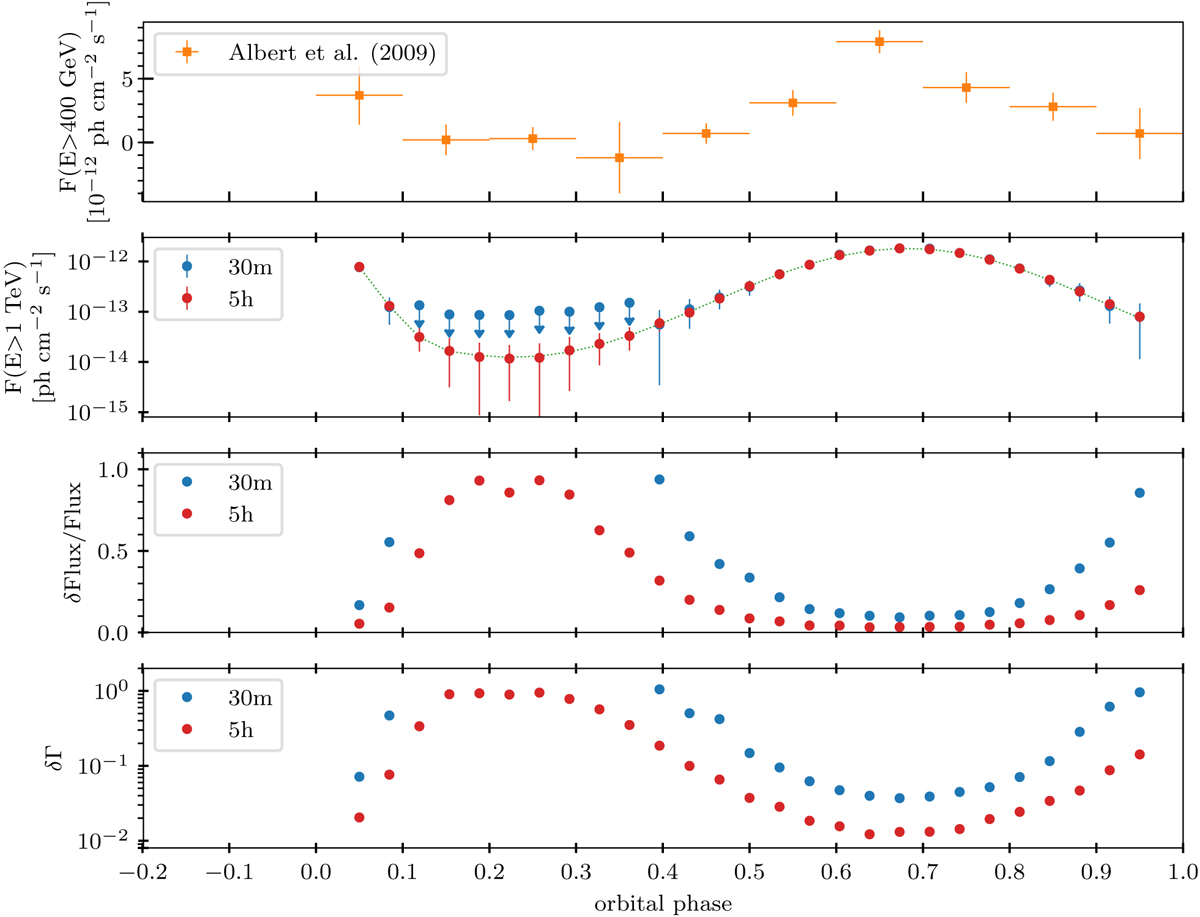
Upper panel: original orbital light curve of LS I +61° 303 as observed by MAGIC (Albert et al. 2009). Next panel: simulated orbital light curve at E > 1 TeV, where the green line shows the simulated flux and the arrows represent 2σ upper limits. Third panel: relative uncertainty of the simulated flux. Bottom panel: uncertainty in the simulated photon index. In all panels the exposure time is shown with colours: blue corresponds to 30 min and red to 5 h.
Current usage metrics show cumulative count of Article Views (full-text article views including HTML views, PDF and ePub downloads, according to the available data) and Abstracts Views on Vision4Press platform.
Data correspond to usage on the plateform after 2015. The current usage metrics is available 48-96 hours after online publication and is updated daily on week days.
Initial download of the metrics may take a while.