Free Access
Fig. 2.
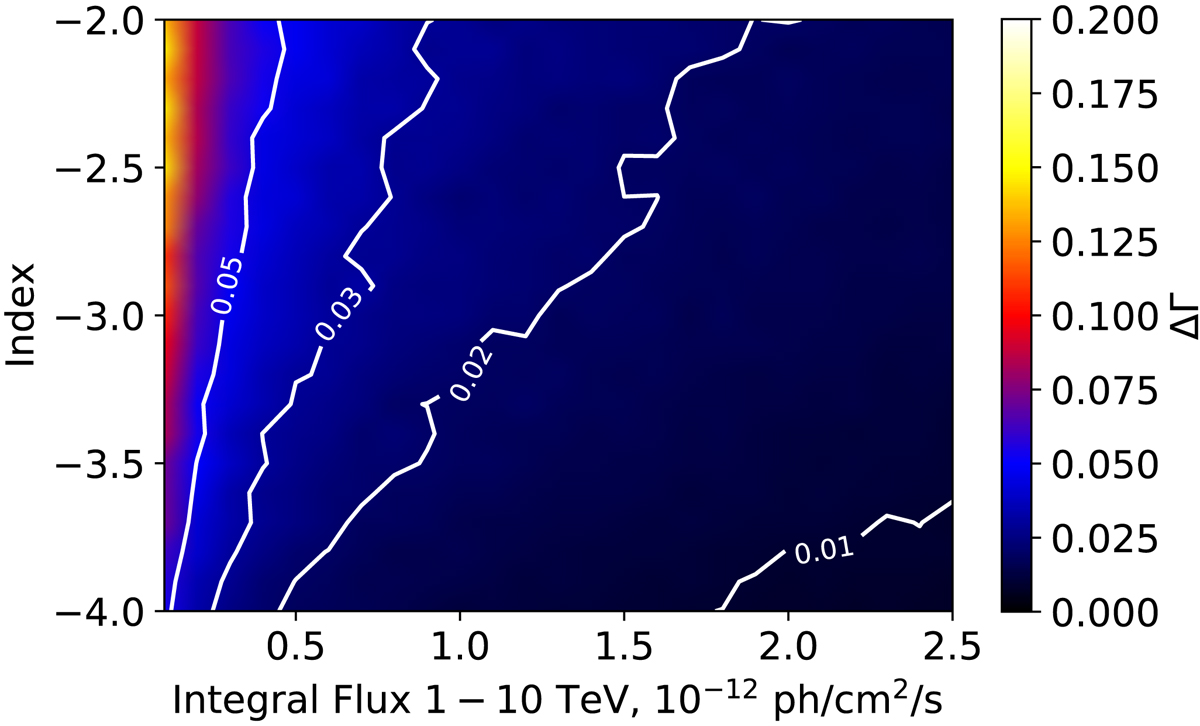
Uncertainty on the slope (colour bar) as a function of the slope value and the flux in the 1 − 10 TeV energy range for 5 h observations of a point-like source at the position of PSR B1259−63. White lines illustrate the levels of constant slope uncertainty.
Current usage metrics show cumulative count of Article Views (full-text article views including HTML views, PDF and ePub downloads, according to the available data) and Abstracts Views on Vision4Press platform.
Data correspond to usage on the plateform after 2015. The current usage metrics is available 48-96 hours after online publication and is updated daily on week days.
Initial download of the metrics may take a while.