Fig. 14.
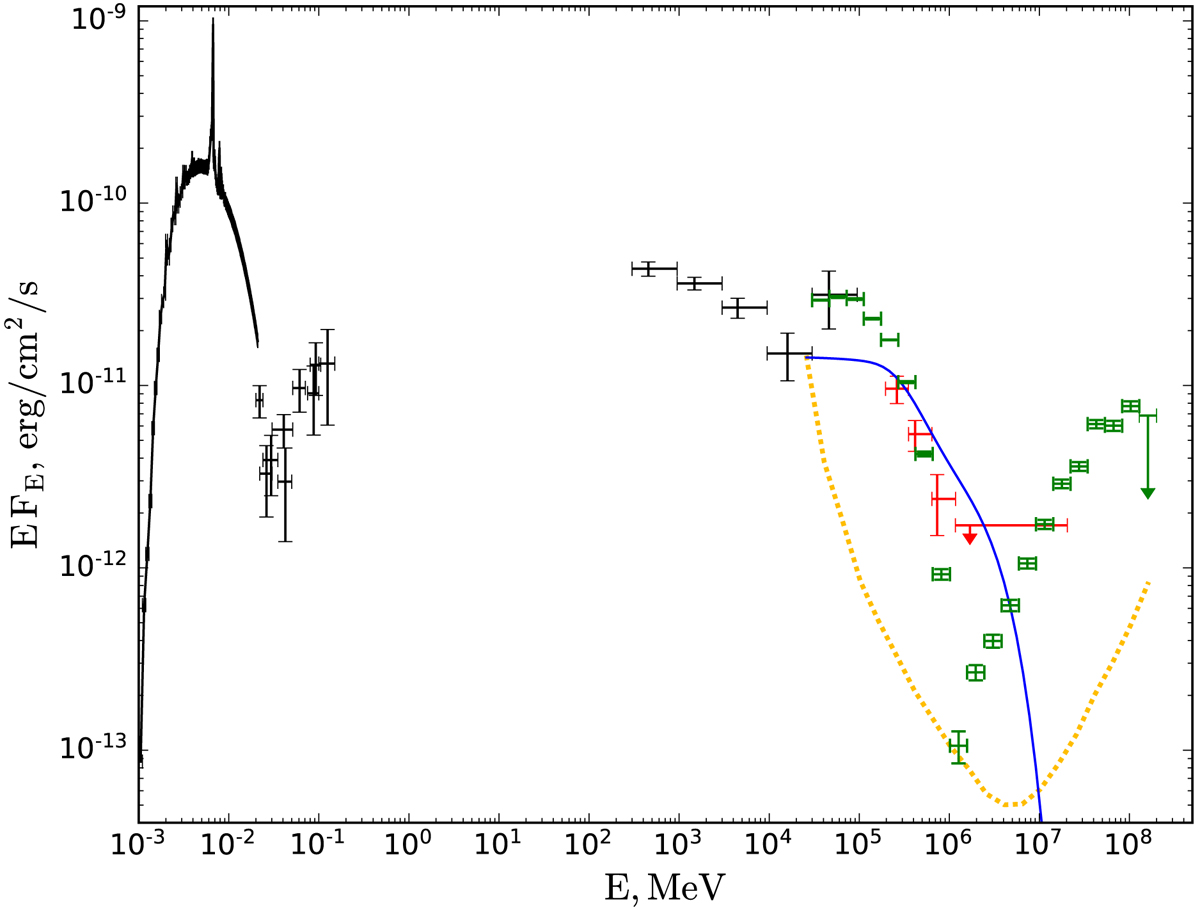
Shock-induced spectral energy distribution in η Car from 1 keV to 1 PeV. The data (black) are from NuSTAR (Panagiotou & Walter 2018), Swift/BAT, INTEGRAL, and Fermi-LAT. The red points are the H.E.S.S. measurements obtained close to periastron. Green points show a 50-hour simulated observation by the CTA at periastron. The blue line shows the spectrum that might be expected at apastron with a lower energy cut-off and obscuration. The system geometry can be constrained by a shift of the obscuration peak throughout the orbit, which is not taken into account here. The yellow dotted line is the 50 h CTA point-source sensitivity (5σ per bin of ΔE/E = 0.2).
Current usage metrics show cumulative count of Article Views (full-text article views including HTML views, PDF and ePub downloads, according to the available data) and Abstracts Views on Vision4Press platform.
Data correspond to usage on the plateform after 2015. The current usage metrics is available 48-96 hours after online publication and is updated daily on week days.
Initial download of the metrics may take a while.