Free Access
Fig. 10.
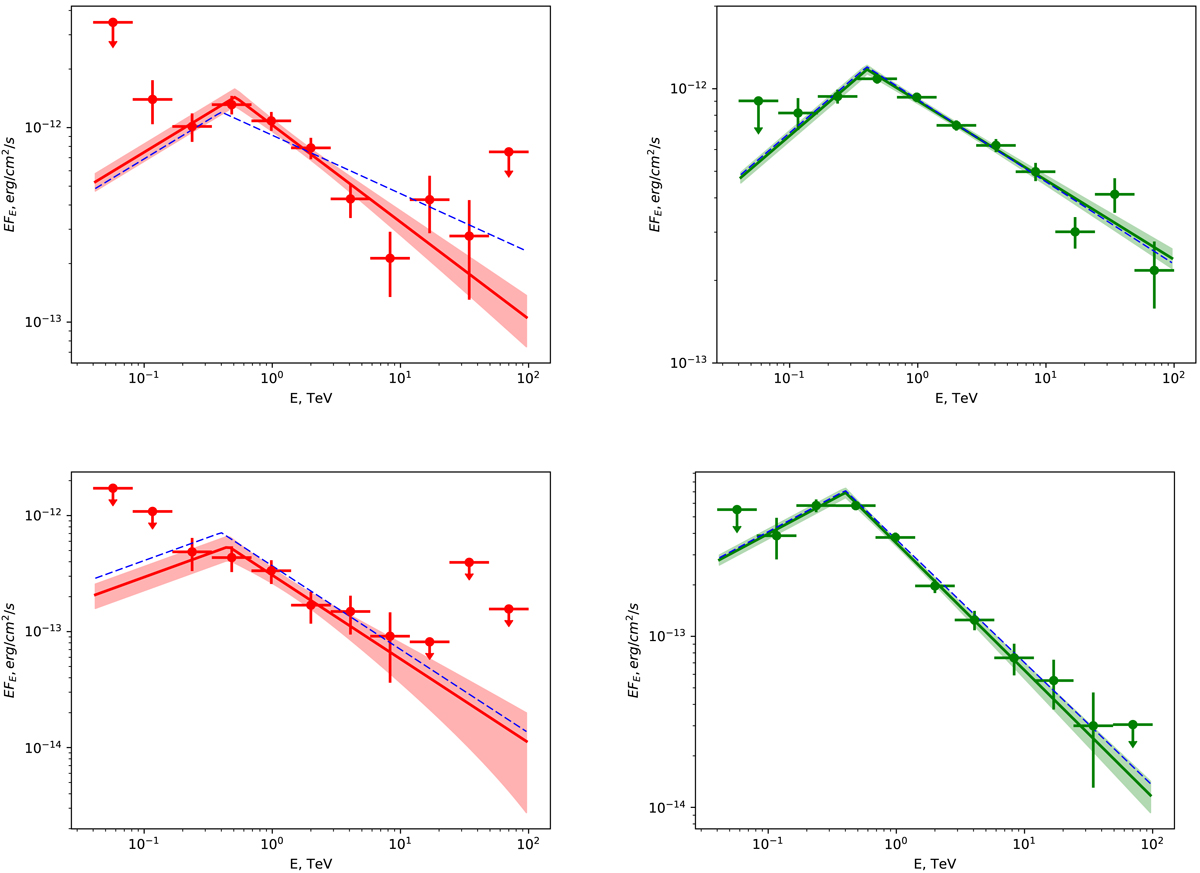
Simulated spectra (red and green points) of HESS J0632+057, as observed from the southern site. In blue we show the input models. Upper left: high state, 5 h. Upper right: high state, 50 h. Lower left: low state, 5 h. Lower right: low state, 50 h.
Current usage metrics show cumulative count of Article Views (full-text article views including HTML views, PDF and ePub downloads, according to the available data) and Abstracts Views on Vision4Press platform.
Data correspond to usage on the plateform after 2015. The current usage metrics is available 48-96 hours after online publication and is updated daily on week days.
Initial download of the metrics may take a while.