Fig. 1.
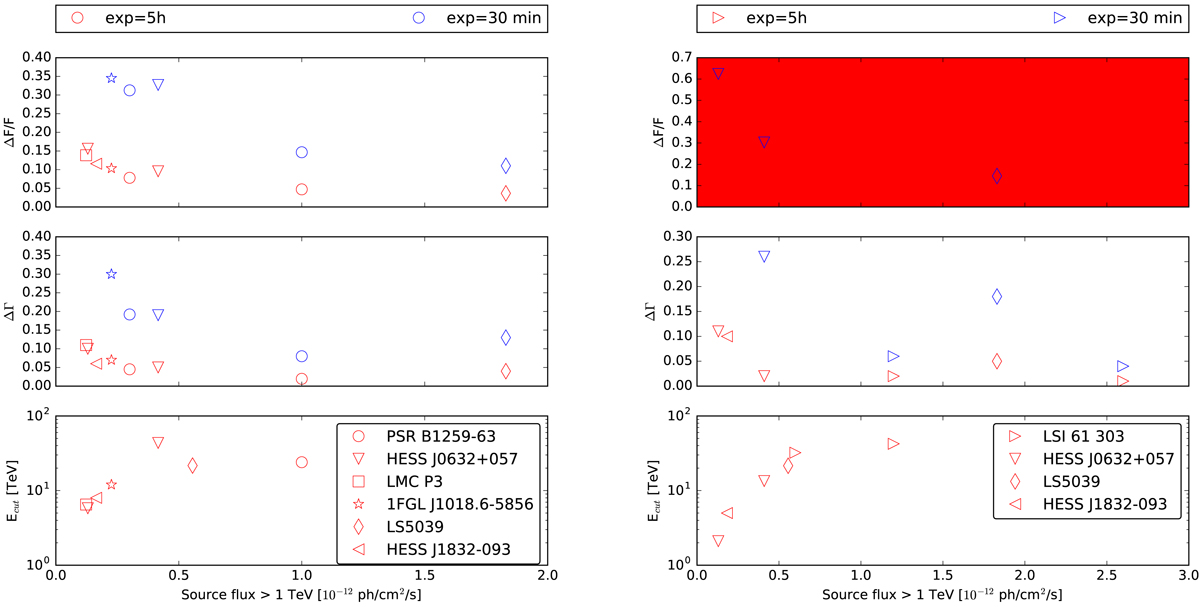
Summary of the simulations we performed for the different binaries for various exposure times and telescope configurations. Left and right panels: south and north sites, respectively. Exposure time is shown with colours: blue corresponds to 30 min and red to 5 h. In this figure, we show the dependence of the relative flux error (top panel), spectral slope error (middle panel), and maximum energy up to which a cut-off can be excluded (bottom panel).
Current usage metrics show cumulative count of Article Views (full-text article views including HTML views, PDF and ePub downloads, according to the available data) and Abstracts Views on Vision4Press platform.
Data correspond to usage on the plateform after 2015. The current usage metrics is available 48-96 hours after online publication and is updated daily on week days.
Initial download of the metrics may take a while.