Fig. 6.
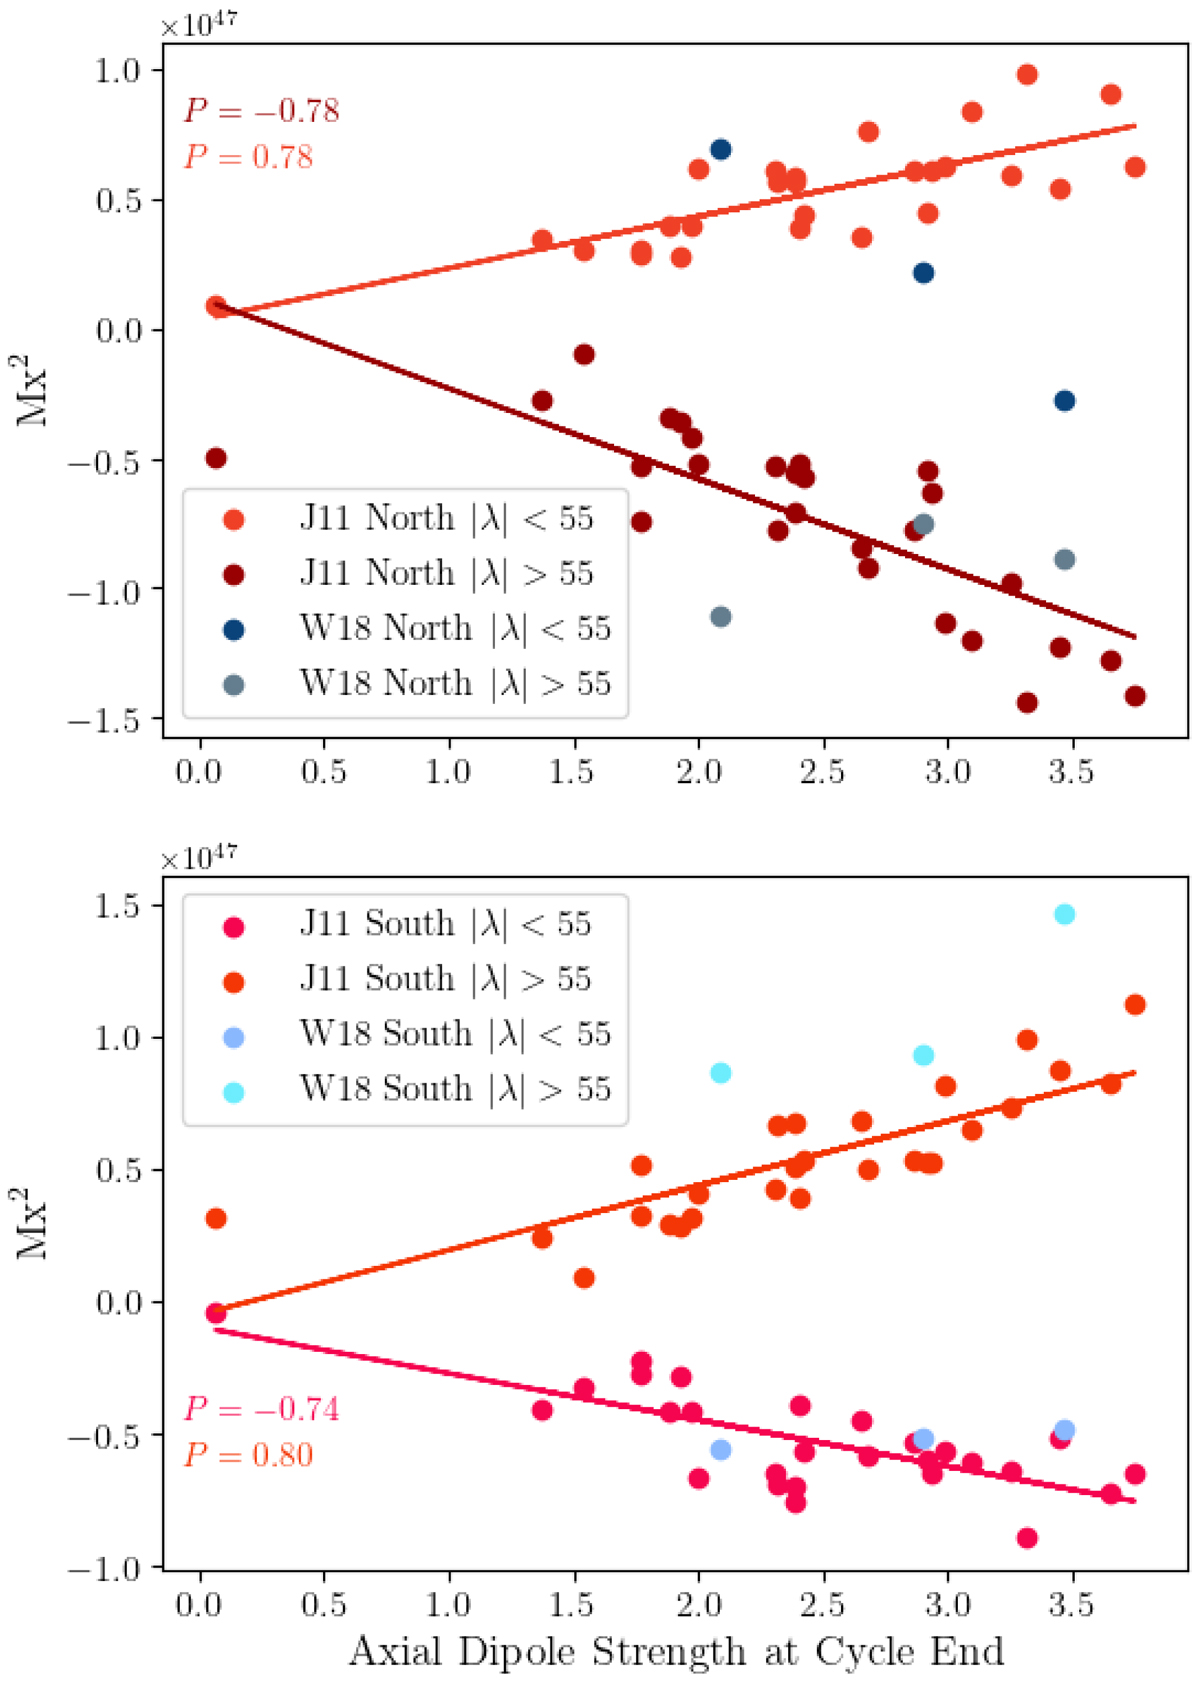
Scatter plots of integrated helicity flux per cycle in each sub-hemisphere for both W18 and J11, plotted against the axial dipole strength (absolute value) at the end of each cycle. This time is defined as the time of minimum unsigned magnetic flux in Figs.1a and 2a. Lines of best fit and Pearson’s correlation coefficient are calculated for the J11 data.
Current usage metrics show cumulative count of Article Views (full-text article views including HTML views, PDF and ePub downloads, according to the available data) and Abstracts Views on Vision4Press platform.
Data correspond to usage on the plateform after 2015. The current usage metrics is available 48-96 hours after online publication and is updated daily on week days.
Initial download of the metrics may take a while.