Fig. 5
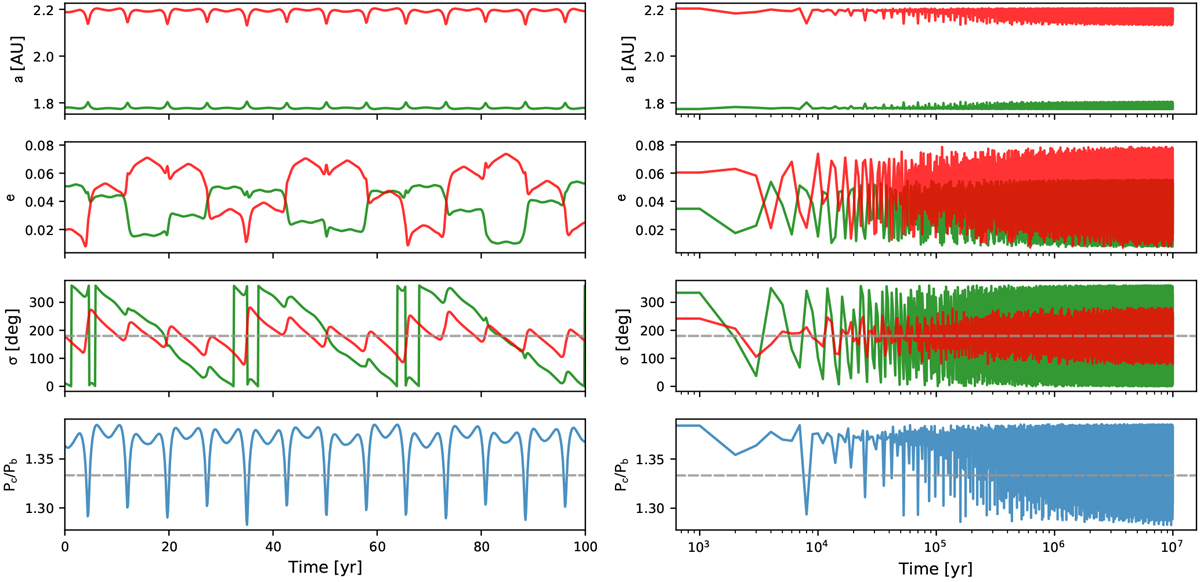
Semimajor axes, eccentricities, resonant angles, and period-ratio evolution of one of the stable fits for 10 Myr. Planet b is shown in green, while planet c is in red. The left panel shows a 100 yr zoomed region of the complete 10 Myr simulation, shown in the right panel (we note the logarithmic scale in the X-axis). The system suffers from strong gravitational interactions on very short timescales, but it can preserve stability for 10 Myr.
Current usage metrics show cumulative count of Article Views (full-text article views including HTML views, PDF and ePub downloads, according to the available data) and Abstracts Views on Vision4Press platform.
Data correspond to usage on the plateform after 2015. The current usage metrics is available 48-96 hours after online publication and is updated daily on week days.
Initial download of the metrics may take a while.